Chrysler 2004 Annual Report Download - page 39
Download and view the complete annual report
Please find page 39 of the 2004 Chrysler annual report below. You can navigate through the pages in the report by either clicking on the pages listed below, or by using the keyword search tool below to find specific information within the annual report.-
 1
1 -
2
-
3
-
4
-
5
-
6
-
7
-
8
-
9
-
10
-
11
-
12
-
13
-
14
-
15
-
16
-
17
-
18
-
19
-
20
-
21
-
22
-
23
-
24
-
25
-
26
-
27
-
28
-
 29
29 -
 30
30 -
 31
31 -
 32
32 -
 33
33 -
 34
34 -
 35
35 -
 36
36 -
 37
37 -
 38
38 -
 39
39 -
 40
40 -
 41
41 -
 42
42 -
 43
43 -
 44
44 -
 45
45 -
 46
46 -
 47
47 -
 48
48 -
 49
49 -
50
-
51
-
52
-
53
-
54
-
55
-
56
-
57
-
58
-
59
-
60
-
61
-
62
-
63
-
64
-
65
-
66
-
67
-
68
-
69
-
70
-
71
-
72
-
73
-
74
-
75
-
76
-
77
-
78
-
79
-
80
-
81
-
82
-
83
-
84
-
85
-
86
-
87
-
88
-
89
-
90
-
91
-
92
-
93
-
94
-
95
-
96
-
97
-
98
-
99
-
100
-
101
-
102
-
103
-
104
-
105
-
106
-
107
-
108
-
109
-
110
-
111
-
112
-
113
-
114
-
115
-
116
-
117
-
118
-
119
-
120
-
121
-
122
-
123
-
124
-
125
-
126
-
127
-
128
-
129
-
130
-
131
-
132
-
133
-
134
-
135
-
136
-
137
-
138
-
139
-
140
-
141
-
142
-
143
-
144
-
145
-
146
-
147
-
148
-
149
-
150
-
151
-
152
-
153
-
154
-
155
-
156
-
157
-
158
-
159
-
160
-
161
-
162
-
163
-
164
-
165
-
166
-
167
-
168
-
169
-
170
-
171
-
172
-
173
-
174
-
175
-
176
-
177
-
178
-
179
-
180
-
181
-
182
-
183
-
184
-
185
-
186
-
187
-
188
-
189
-
190
-
191
-
192
-
193
-
194
-
195
-
196
-
197
-
198
-
199
-
200
-
201
-
202
-
203
-
204
-
205
-
206
-
207
-
208
-
209
-
210
-
211
-
212
-
213
-
214
-
215
-
216
-
217
-
218
-
219
-
220
-
221
-
222
-
223
-
224
-
225
-
226
-
227
 |
 |

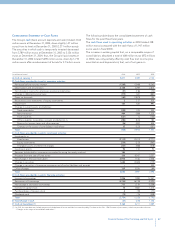
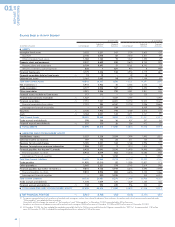
CONSOLIDATED STATEMENT OF CASH FLOWS
The Group’s cash (bank account deposits and cash) totaled 3,164
million euros at December 31, 2004, down slightly (-47 million
euros) from its level at December 31, 2003 (3,211 million euros).
The securities in which cash is temporarily invested decreased
from 3,789 million euros at December 31, 2003 to 2,126 million
euros at December 31, 2004: thus, the Group’s liquid assets at
December 31, 2004 totaled 5,290 million euros, down by 1,710
million euros after reimbursement of bonds for 2.7 billion euros.
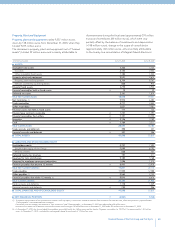
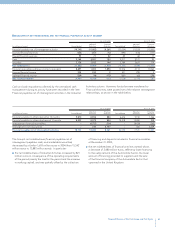
The following table shows the consolidated statement of cash
flows for the past three fiscal years.
The cash flows used in operating activities in 2004 totaled 358
million euros (compared with the cash flows of 1,947 million
euros used in fiscal 2003).
The increase in working capital that, on a comparable scope of
consolidation, absorbed a total of 608 million euros (872 millions
in 2003), was only partially offset by cash flow (net income plus
amortization and depreciation) that, net of net gains on
37
Financial Review of the Fiat Group and Fiat S.p.A.
(in millions of euros) 2004 2003 2002
A)Cash at January 1 3,211 3,489 2,133
B)Cash flows provided by (used in) operating activities:
Net result before minority interest (1,548) (1,948) (4,263)
Depreciation and amortization 2,168 2,269 2,614
Net change in reserve for employee severance indemnities (37) (136) (70)
Change in deferred income taxes (319) 422 (884)
Gains on disposals (162) (1,873) 124
Revaluations and writedowns of equity investments 2177 525
Impairment 147 424 991
Change in current assets and liabilities:
Trade receivables (259) 125 423
Net inventories 464 (389) 1,325
Trade payables (531) 6 (104)
Other payables, receivables, accruals and deferrals (1) (282) (614) 184
Reserve for income taxes and other reserves (36) (287) 545
Changes in the scope of consolidation and others 35 (123) (357)
Total (358) (1,947) 1,053
C)Cash flows provided by (used in) investment activities:
Investments in:
Fixed assets (2,112) (2,011) (2,771)
Equity investments (239) (212) (563)
Intangible assets and deferred charges (237) (488) (518)
Investment grants 92 134 90
Reserves distributed by companies accounted for using the equity method 184 ––
Proceeds from the sale of fixed assets 358 4,167 3,231
Net change in financial receivables 2,976 1,146 2,456
Change in securities 1,684 (3,065) (175)
Change in securities of insurance companies net of policy liabilities and accruals –– 430
Other changes 339 3,226 (84)
Total 3,045 2,897 2,096
D)Cash flows provided by (used in) financing activities:
Increase in borrowings 1,256 1,989 12,047
Repayment of borrowings (4,704) (6,178) (9,392)
Net change in short-term borrowings 713 1,134 (5,358)
Increase in capital stock 16 1,860 1,215
Purchase/Sales of treasury stock 4(18) (77)
Dividends paid (19) (15) (228)
Total (2,734) (1,228) (1,793)
E)Total change in cash (47) (278) 1,356
F)Cash at December 31 3,164 3,211 3,489
(1) In 2002, this item does not include payment of the balance of assets and liabilities contributed by Fiat Auto to the Fiat - GM Powertrain joint venture, which was posted at the item
“Changes in the scope of consolidation and others.”