Chrysler 2004 Annual Report Download - page 34
Download and view the complete annual report
Please find page 34 of the 2004 Chrysler annual report below. You can navigate through the pages in the report by either clicking on the pages listed below, or by using the keyword search tool below to find specific information within the annual report.-
 1
1 -
2
-
3
-
4
-
5
-
6
-
7
-
8
-
9
-
10
-
11
-
12
-
13
-
14
-
15
-
16
-
17
-
18
-
19
-
20
-
21
-
22
-
23
-
 24
24 -
 25
25 -
 26
26 -
 27
27 -
 28
28 -
 29
29 -
 30
30 -
 31
31 -
 32
32 -
 33
33 -
 34
34 -
 35
35 -
 36
36 -
 37
37 -
 38
38 -
 39
39 -
 40
40 -
 41
41 -
 42
42 -
 43
43 -
 44
44 -
45
-
46
-
47
-
48
-
49
-
50
-
51
-
52
-
53
-
54
-
55
-
56
-
57
-
58
-
59
-
60
-
61
-
62
-
63
-
64
-
65
-
66
-
67
-
68
-
69
-
70
-
71
-
72
-
73
-
74
-
75
-
76
-
77
-
78
-
79
-
80
-
81
-
82
-
83
-
84
-
85
-
86
-
87
-
88
-
89
-
90
-
91
-
92
-
93
-
94
-
95
-
96
-
97
-
98
-
99
-
100
-
101
-
102
-
103
-
104
-
105
-
106
-
107
-
108
-
109
-
110
-
111
-
112
-
113
-
114
-
115
-
116
-
117
-
118
-
119
-
120
-
121
-
122
-
123
-
124
-
125
-
126
-
127
-
128
-
129
-
130
-
131
-
132
-
133
-
134
-
135
-
136
-
137
-
138
-
139
-
140
-
141
-
142
-
143
-
144
-
145
-
146
-
147
-
148
-
149
-
150
-
151
-
152
-
153
-
154
-
155
-
156
-
157
-
158
-
159
-
160
-
161
-
162
-
163
-
164
-
165
-
166
-
167
-
168
-
169
-
170
-
171
-
172
-
173
-
174
-
175
-
176
-
177
-
178
-
179
-
180
-
181
-
182
-
183
-
184
-
185
-
186
-
187
-
188
-
189
-
190
-
191
-
192
-
193
-
194
-
195
-
196
-
197
-
198
-
199
-
200
-
201
-
202
-
203
-
204
-
205
-
206
-
207
-
208
-
209
-
210
-
211
-
212
-
213
-
214
-
215
-
216
-
217
-
218
-
219
-
220
-
221
-
222
-
223
-
224
-
225
-
226
-
227
 |
 |

REPORT ON
OPERATIONS
01
32
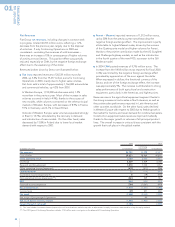
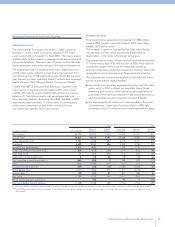
Result before taxes
The Group’s loss before taxes was 1,577 million euros,
compared with a loss of 1,298 million euros in 2003 (loss of 1,501
million euros for Continuing Operations). The slight worsening
in comparison with the figure for Continuing Operations stems
from the previously mentioned decrease in EBIT, although this
was offset by lower net financial expenses.
Net financial expenses totaled 744 million euros in 2004,
compared with 979 million euros in 2003. The comparison
with Continuing Operations alone, which had total net financial
expenses of 1,067 million euros, shows an improvement of 323
million euros. Excluding the net positive effect of approximately
300 million euros in non-recurring gains from the unwinding of
the equity swap on General Motors shares and the negative
effects of adjustments to receivables and financial fixed assets
of approximately 90 million euros, the improvement with respect
to Continuing Operations is largely attributable to the lower
average level of indebtedness in 2004, and lower interest rates.
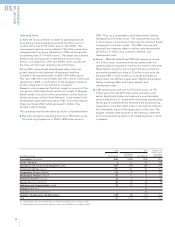
Result for the Fiscal Year
The consolidated net loss before minority interest was 1,548
million euros, compared with the loss of 1,948 million euros in
2003 (net loss of 2,042 million euros for Continuing Operations).
Income taxes totaled a positive balance of 29 million euros,
compared with a negative balance of 541 million euros for
Continuing Operations in 2003 (and a negative balance of 650
million euros at the consolidated level). The income taxes due
for fiscal 2004 include: 128 million euros (125 million euros in
2003) for IRAP, the regional tax on production activities in Italy
and 187 million euros (31 million euros in 2003) for other current
taxes, largely in consequence of the positive results posted by
a number of companies operating abroad. These amounts were
offset by the benefits of the Italian tax consolidation program
and posting of net deferred tax assets, principally for Fiat S.p.A.,
the recovery of which became reasonably certain in
consequence of the settlement received in February 2005 upon
termination of the Master agreement with General Motors.
Income taxes in 2003 included the reversal of 494 million euros
in deferred tax assets, largely against the gains realized upon
sale of the Toro Assicurazioni Group and FiatAvio S.p.A.
The Group’s interest in net loss was 1,586 million euros,
compared with a loss of 1,900 million euros in fiscal 2003.
As a result, the net loss per share amounted to 1.62 euros,
compared with a net loss per share of 2.412 euros in 2003.
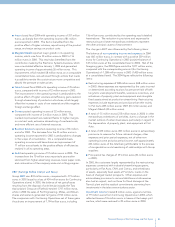
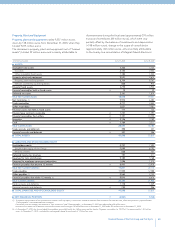
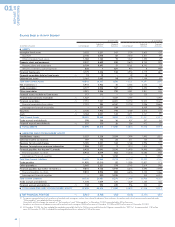
BALANCE SHEET
On the previous page, the financial structure shows items on
both the assets and liabilities side, with a breakdown between
current and non-current assets and liabilities. Specifically:
■In addition to cash and securities, current assets include
assets held for sale or consumption in the normal course
of business and thus comprise assets generated by financial
services, including assets under financial lease. Current assets
also include amounts which are expected to be received
within twelve months of the year-end.
■Current liabilities include those to be settled in the normal
course of business, liabilities held primarily for trading
purposes, and those due within twelve months of the
year-end or which cannot be renegotiated in that period.
The following analysis provides the information necessary for
correlation with the principal items characteristic of the industrial
activities, such as working capital and net invested capital.
For a more complete analysis of these items, please see
the Notes to the Consolidated Financial Statements.
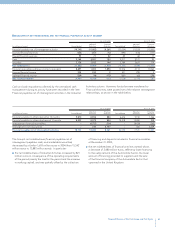
Intangible Fixed Assets
Intangible fixed assets (start-up and expansion costs, goodwill,
intangible fixed assets in progress, and others) totaled 3,322
million euros, down by 402 million euros from the 3,724 million
euros at December 31, 2003. Of this decrease, approximately
160 million euros are attributable to changes in foreign
exchange rates, which particularly impacted the carrying value
of goodwill, and 211 million euros are attributable to the
negative balance of amortization and investments.
Investments during the year totaled 264 million euros (527
million euros in 2003), while amortization totaled 475 million
euros (519 million euros in 2003), of which 162 million euros
for goodwill (192 million euros in 2003).