Capital One 2004 Annual Report Download - page 99
Download and view the complete annual report
Please find page 99 of the 2004 Capital One annual report below. You can navigate through the pages in the report by either clicking on the pages listed below, or by using the keyword search tool below to find specific information within the annual report.-
 1
1 -
2
-
3
-
4
-
5
-
6
-
7
-
8
-
9
-
10
-
11
-
12
-
13
-
14
-
15
-
16
-
17
-
18
-
19
-
20
-
21
-
22
-
23
-
24
-
25
-
26
-
27
-
28
-
29
-
30
-
31
-
32
-
33
-
34
-
35
-
36
-
37
-
38
-
39
-
40
-
41
-
42
-
43
-
44
-
45
-
46
-
47
-
48
-
49
-
50
-
51
-
52
-
53
-
54
-
55
-
56
-
57
-
58
-
59
-
60
-
61
-
62
-
63
-
64
-
65
-
66
-
67
-
68
-
69
-
70
-
71
-
72
-
73
-
74
-
75
-
76
-
77
-
78
-
79
-
80
-
81
-
82
-
83
-
84
-
85
-
86
-
87
-
88
-
 89
89 -
 90
90 -
 91
91 -
 92
92 -
 93
93 -
 94
94 -
 95
95 -
 96
96 -
 97
97 -
 98
98 -
 99
99 -
 100
100 -
 101
101 -
 102
102 -
 103
103 -
 104
104 -
 105
105 -
 106
106 -
 107
107 -
 108
108 -
 109
109 -
110
-
111
-
112
-
113
-
114
-
115
-
116
-
117
-
118
-
119
-
120
-
121
-
122
-
123
-
124
-
125
-
126
-
127
-
128
-
129
-
130
-
131
-
132
-
133
-
134
-
135
-
136
-
137
 |
 |

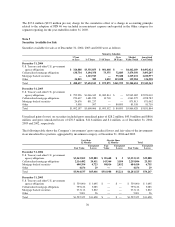
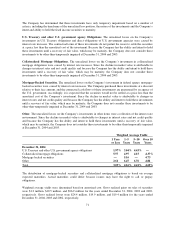
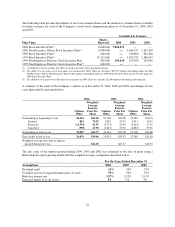
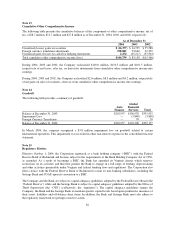
The following table provides the number of reserved common shares and the number of common shares available
for future issuance for each of the Company’s stock-based compensation plans as of December 31, 2004, 2003
and 2002:
Available For Issuance
Plan Name
Shares
Reserved 2004 2003 2002
2004 Stock Incentive Plan(1) 8,000,000 7,068,515 ——
2002 Non-Executive Officer Stock Incentive Plan(2) 8,500,000 —1,464,227 2,167,450
1999 Stock Incentive Plan(2) 600,000 —338,800 322,300
1994 Stock Incentive Plan(2) 67,112,640 —1,423,352 2,186,615
1999 Non-Employee Directors Stock Incentive Plan 825,000 193,430 195,920 220,000
1995 Non-Employee Directors Stock Incentive Plan(3) 600,000 ———
(1) Available for issuance includes the CEO restricted stock units at their maximum amount.
(2) The ability to issue grants out of these plans was terminated in 2004. There are currently 3,095,553 options outstanding under the 2002
Non-Executive Officer Stock Incentive Plan, 96,025 options outstanding under the 1999 Stock Incentive Plan and 27,378,251 under the
1994 Stock Incentive Plan.
(3) The ability to issue grants out of this plan was terminated in 1999. There are currently 252,000 options outstanding under the plan
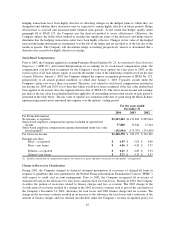
A summary of the status of the Company’s options as of December 31, 2004, 2003 and 2002, and changes for the
years then ended is presented below:
2004 2003 2002
Options
(000s)
Weighted-
Average
Exercise
Price Per
Share
Options
(000s)
Weighted-
Average
Exercise
Price Per
Share
Options
(000s)
Weighted-
Average
Exercise
Price Per
Share
Outstanding at beginning of year 44,654 $42.00 52,108 $40.06 49,180 $40.74
Granted 801 79.47 1,930 55.42 6,631 36.52
Exercised (12,370) 41.97 (5,737) 23.99 (1,623) 27.19
Cancelled (998) 47.58 (3,647) 50.76 (2,080) 53.31
Outstanding at end of year 32,087 $42.77 44,654 $42.00 52,108 $40.06
Exercisable at end of year 24,079 $39.06 23,923 $35.87 23,340 $30.20
Weighted-average fair value of options
granted during the year $42.29 $27.27 $16.53
The fair value of the options granted during 2004, 2003 and 2002 was estimated at the date of grant using a
Black-Scholes option-pricing model with the weighted average assumptions described below:
For the Years Ended December 31
Assumptions 2004 2003 2002
Dividend yield .15% .24% .25%
Volatility factors of expected market price of stock 55% 54% 55%
Risk-free interest rate 3.57% 3.25% 3.15%
Expected option lives (in years) 5.8 5.0 5.0
76