Capital One 2004 Annual Report Download - page 71
Download and view the complete annual report
Please find page 71 of the 2004 Capital One annual report below. You can navigate through the pages in the report by either clicking on the pages listed below, or by using the keyword search tool below to find specific information within the annual report.-
 1
1 -
2
-
3
-
4
-
5
-
6
-
7
-
8
-
9
-
10
-
11
-
12
-
13
-
14
-
15
-
16
-
17
-
18
-
19
-
20
-
21
-
22
-
23
-
24
-
25
-
26
-
27
-
28
-
29
-
30
-
31
-
32
-
33
-
34
-
35
-
36
-
37
-
38
-
39
-
40
-
41
-
42
-
43
-
44
-
45
-
46
-
47
-
48
-
49
-
50
-
51
-
52
-
53
-
54
-
55
-
56
-
57
-
58
-
59
-
60
-
 61
61 -
 62
62 -
 63
63 -
 64
64 -
 65
65 -
 66
66 -
 67
67 -
 68
68 -
 69
69 -
 70
70 -
 71
71 -
 72
72 -
 73
73 -
 74
74 -
 75
75 -
 76
76 -
 77
77 -
 78
78 -
 79
79 -
 80
80 -
 81
81 -
82
-
83
-
84
-
85
-
86
-
87
-
88
-
89
-
90
-
91
-
92
-
93
-
94
-
95
-
96
-
97
-
98
-
99
-
100
-
101
-
102
-
103
-
104
-
105
-
106
-
107
-
108
-
109
-
110
-
111
-
112
-
113
-
114
-
115
-
116
-
117
-
118
-
119
-
120
-
121
-
122
-
123
-
124
-
125
-
126
-
127
-
128
-
129
-
130
-
131
-
132
-
133
-
134
-
135
-
136
-
137
 |
 |

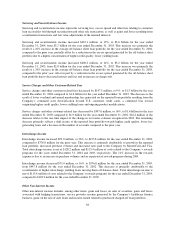
In April 2002, COAF entered into a revolving warehouse credit facility collateralized by a security interest in
certain auto loan assets (the “Collateralized Revolving Credit Facility”). As of December 31, 2004, the credit
facility had the capacity to issue up to $4.4 billion in secured notes. The Collateralized Revolving Credit Facility
has multiple participants each with a separate renewal date. The facility does not have a final maturity date.
Instead, each participant may elect to renew the commitment for another set period of time. Interest on the
facility is based on commercial paper rates.
As of December 31, 2004, the Corporation had one effective shelf registration statement under which the
Corporation from time to time may offer and sell senior or subordinated debt securities, preferred stock, common
stock, common equity units and stock purchase contracts.
The Company continues to expand its retail deposit gathering efforts through both direct and broker marketing
channels. As a result of the Company becoming a bank holding company and the amendment of the Bank’s
Virginia charter, the Bank began accepting deposits of less than $100 thousand through its brokered channel.
This change lowers the cost of deposits gathered through the brokered channel and materially expands its
potential capacity. The Company uses its data analysis capabilities to test and market a variety of retail deposit
origination strategies, including via the Internet, as well as, to develop customized account management
programs. As of December 31, 2004, the Company had $25.6 billion in interest-bearing deposits of which $2.3
billion were held in foreign banking offices and $12.2 billion represented large denomination certificates of $100
thousand or more with original maturities up to ten years.
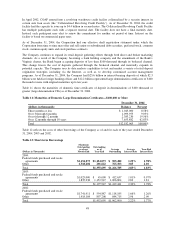
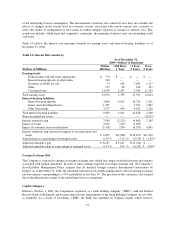
Table 11 shows the maturities of domestic time certificates of deposit in denominations of $100 thousand or
greater (large denomination CDs) as of December 31, 2004.
Table 11: Maturities of Domestic Large Denomination Certificates—$100,000 or More
December 31, 2004
(dollars in thousands) Balance Percent
Three months or less $ 1,045,000 8.58%
Over 3 through 6 months 1,099,953 9.03%
Over 6 through 12 months 2,383,230 19.56%
Over 12 months through 10 years 7,653,882 62.83%
Total $12,182,065 100.00%
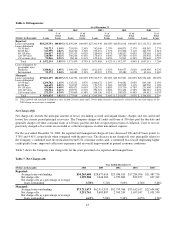
Table 12 reflects the costs of other borrowings of the Company as of and for each of the years ended December
31, 2004, 2003 and 2002.
Table 12: Short-term Borrowings
(Dollars in Thousands)
Maximum
Outstanding
as of any
Month-End
Outstanding
as of
Year-End
Average
Outstanding
Average
Interest Rate
Year-End
Interest Rate
2004:
Federal funds purchased and resale
agreements $1,154,073 $1,154,073 $ 503,482 1.29% 1.78%
Other 1,318,404 201,622 763,303 3.85 2.10
Total $1,355,695 $1,266,785 2.83% 1.83%
2003:
Federal funds purchased and resale
agreements $1,025,000 $ 45,000 $ 412,637 1.01% 0.97%
Other 1,835,238 1,152,947 1,006,804 2.82 1.81
Total $1,197,947 $1,419,441 2.30% 1.78%
2002:
Federal funds purchased and resale
agreements $1,741,911 $ 554,887 $1,118,185 1.66% 1.26%
Other 1,418,184 897,208 844,715 2.96 2.09
Total $1,452,095 $1,962,900 2.22% 1.77%
48