Capital One 2004 Annual Report Download - page 61
Download and view the complete annual report
Please find page 61 of the 2004 Capital One annual report below. You can navigate through the pages in the report by either clicking on the pages listed below, or by using the keyword search tool below to find specific information within the annual report.-
 1
1 -
2
-
3
-
4
-
5
-
6
-
7
-
8
-
9
-
10
-
11
-
12
-
13
-
14
-
15
-
16
-
17
-
18
-
19
-
20
-
21
-
22
-
23
-
24
-
25
-
26
-
27
-
28
-
29
-
30
-
31
-
32
-
33
-
34
-
35
-
36
-
37
-
38
-
39
-
40
-
41
-
42
-
43
-
44
-
45
-
46
-
47
-
48
-
49
-
50
-
 51
51 -
 52
52 -
 53
53 -
 54
54 -
 55
55 -
 56
56 -
 57
57 -
 58
58 -
 59
59 -
 60
60 -
 61
61 -
 62
62 -
 63
63 -
 64
64 -
 65
65 -
 66
66 -
 67
67 -
 68
68 -
 69
69 -
 70
70 -
 71
71 -
72
-
73
-
74
-
75
-
76
-
77
-
78
-
79
-
80
-
81
-
82
-
83
-
84
-
85
-
86
-
87
-
88
-
89
-
90
-
91
-
92
-
93
-
94
-
95
-
96
-
97
-
98
-
99
-
100
-
101
-
102
-
103
-
104
-
105
-
106
-
107
-
108
-
109
-
110
-
111
-
112
-
113
-
114
-
115
-
116
-
117
-
118
-
119
-
120
-
121
-
122
-
123
-
124
-
125
-
126
-
127
-
128
-
129
-
130
-
131
-
132
-
133
-
134
-
135
-
136
-
137
 |
 |
Servicing and Securitizations Income
Servicing and securitizations income represents servicing fees, excess spread and other fees relating to consumer
loan receivables sold through securitization and other sale transactions, as well as gains and losses resulting from
securitization transactions and fair value adjustments of the retained interests.
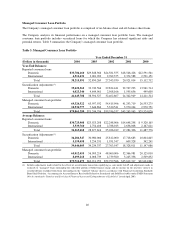
Servicing and securitizations income increased $432.1 million, or 13%, to $3.6 billion for the year ended
December 31, 2004, from $3.2 billion for the year ended December 31, 2003. This increase was primarily the
result of a 16% increase in the average off-balance sheet loan portfolio for the year ended December 31, 2004,
compared to the prior year, partially offset by a reduction in the excess spread generated by the off-balance sheet
portfolio due to a higher concentration of higher credit quality, lower yielding loans.
Servicing and securitizations income increased $406.2 million, or 14%, to $3.2 billion for the year ended
December 31, 2003, from $2.8 billion for the year ended December 31, 2002. This increase was primarily the
result of a 24% increase in the average off-balance sheet loan portfolio for the year ended December 31, 2003,
compared to the prior year, offset in part by a reduction in the excess spread generated by the off-balance sheet
loan portfolio due to decreased interest and fees and an increase in charge-offs.
Service Charges and Other Customer-Related Fees
Service charges and other customer-related fees decreased by $147.5 million, or 9%, to $1.5 billion for the year
ended December 31, 2004 compared to $1.6 billion for the year ended December 31, 2003. The decrease is the
result of lower overlimit and annual membership fees generated on the reported loan portfolio resulting from the
Company’s continued asset diversification beyond U.S. consumer credit cards, a continued bias toward
originating higher credit quality, lower yielding loans and ongoing product modifications.
Service charges and other customer-related fees decreased by $307.6 million, or 16%, to $1.6 billion for the year
ended December 31, 2003 compared to $1.9 billion for the year ended December 31, 2002. $44.4 million of the
decrease relates to the one-time impact of the change in recoveries estimate recognized in 2002. The remaining
decrease primarily reflects a shift in mix of the reported loan portfolio towards higher credit quality, lower fee-
generating loans and a decrease in the number of accounts compared to the prior year.
Interchange Income
Interchange income increased $99.0 million, or 26%, to $475.8 million for the year ended December 31, 2004,
compared to $376.8 million for the prior year. This increase is primarily attributable to growth in the reported
loan portfolio, increased purchase volumes and increased rates paid to the Company by MasterCard and Visa.
Total interchange income is net of $128.2 million and $115.4 million of costs related to the Company’s rewards
programs for the years ended December 31, 2004 and 2003, respectively. The 11% increase in the rewards
expense is due to an increase in purchase volumes and an expansion of reward programs during 2004.
Interchange income decreased $71.0 million, or 16%, to $376.8 million for the year ended December 31, 2003,
from $447.8 million for the year ended December 31, 2002. This decrease is primarily attributable to the
securitization of higher interchange yielding loans moving them off-balance sheet. Total interchange income is
net of $115.4 million of costs related to the Company’s rewards programs for the year ended December 31, 2003,
compared to $104.9 million for the year ended December 31, 2002.
Other Non-Interest Income
Other non-interest income includes, among other items, gains and losses on sales of securities, gains and losses
associated with hedging transactions, service provider revenue generated by the Company’s healthcare finance
business, gains on the sale of auto loans and income earned related to purchased charged-off loan portfolios.
38