Capital One 2004 Annual Report Download - page 91
Download and view the complete annual report
Please find page 91 of the 2004 Capital One annual report below. You can navigate through the pages in the report by either clicking on the pages listed below, or by using the keyword search tool below to find specific information within the annual report.-
 1
1 -
2
-
3
-
4
-
5
-
6
-
7
-
8
-
9
-
10
-
11
-
12
-
13
-
14
-
15
-
16
-
17
-
18
-
19
-
20
-
21
-
22
-
23
-
24
-
25
-
26
-
27
-
28
-
29
-
30
-
31
-
32
-
33
-
34
-
35
-
36
-
37
-
38
-
39
-
40
-
41
-
42
-
43
-
44
-
45
-
46
-
47
-
48
-
49
-
50
-
51
-
52
-
53
-
54
-
55
-
56
-
57
-
58
-
59
-
60
-
61
-
62
-
63
-
64
-
65
-
66
-
67
-
68
-
69
-
70
-
71
-
72
-
73
-
74
-
75
-
76
-
77
-
78
-
79
-
80
-
 81
81 -
 82
82 -
 83
83 -
 84
84 -
 85
85 -
 86
86 -
 87
87 -
 88
88 -
 89
89 -
 90
90 -
 91
91 -
 92
92 -
 93
93 -
 94
94 -
 95
95 -
 96
96 -
 97
97 -
 98
98 -
 99
99 -
 100
100 -
 101
101 -
102
-
103
-
104
-
105
-
106
-
107
-
108
-
109
-
110
-
111
-
112
-
113
-
114
-
115
-
116
-
117
-
118
-
119
-
120
-
121
-
122
-
123
-
124
-
125
-
126
-
127
-
128
-
129
-
130
-
131
-
132
-
133
-
134
-
135
-
136
-
137
 |
 |

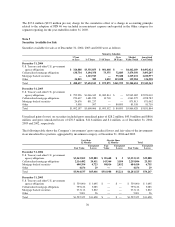
the year ended December 31, 2002. The change in estimate resulted in an increase of $38.4 million to interest
income and $44.4 million to non-interest income offset by an increase in the provision for loan losses of $133.4
million for the year ended December 31, 2002. Therefore, net income for the year ended December 31, 2002, was
negatively impacted by $31.4 million or $.14 per diluted share as a result of the change in estimate.
Note 2
Segments
The Company maintains three distinct operating segments: U.S. Card, Auto Finance, and Global Financial
Services. The U.S. Card segment consists of domestic credit card lending activities. The Auto Finance segment
consists of automobile financing activities. The Global Financial Services segment is comprised of international
lending activities (including credit card lending), installment lending, small business lending and healthcare
financing. The U.S. Card, Auto Finance and Global Financial Services segments are considered reportable
segments based on quantitative thresholds applied to the managed loan portfolio for reportable segments
provided by SFAS No. 131 and are disclosed separately. The Other caption includes the Company’s liquidity
portfolio, emerging businesses not included in the reportable segments, investments in external companies, and
various non-lending activities. The Other caption also includes the net impact of transfer pricing, certain
unallocated expenses and gains/losses related to the securitization of assets.
Management decision making is performed on a managed portfolio basis. An adjustment to reconcile the
managed financial information to the reported financial information in the consolidated financial statements is
provided. This adjustment reclassifies a portion of net interest income, non-interest income and provision for
loan losses into non-interest income from servicing and securitization.
The Company maintains its books and records on a legal entity basis for the preparation of financial statements in
conformity with GAAP. The following tables present information prepared from the Company’s internal
management information system, which is maintained on a line of business level through allocations from the
consolidated financial results.
See Note 1, Significant Accounting Policies, for the accounting policies of the reportable segments.
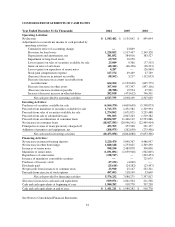
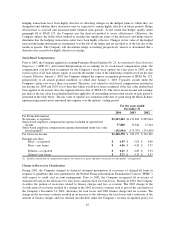
For the Year Ended December 31, 2004
U.S. Card
Auto
Finance
Global
Financial
Services Other
Total
Managed
Securitization
Adjustments
Total
Reported
Net interest income $ 4,655,897 $ 797,936 $ 1,421,508 $(240,599) $ 6,634,742 $ (3,631,764) $ 3,002,978
Non-interest income 3,219,567 80,712 844,192 80,115 4,224,586 1,675,571 5,900,157
Provision for loan losses 2,207,888 279,981 683,612 5,564 3,177,045 (1,956,193) 1,220,852
Non-interest expenses 3,499,918 342,761 1,265,549 213,991 5,322,219 — 5,322,219
Income tax provision (benefit) 780,357 92,126 103,459 (159,360) 816,582 — 816,582
Net income (loss) $ 1,387,301 $ 163,780 $ 213,080 $(220,679) $ 1,543,482 $ — $ 1,543,482
Loans receivable $48,609,571 $9,997,497 $21,240,325 $ 13,906 $79,861,299 $(41,645,708) $38,215,591
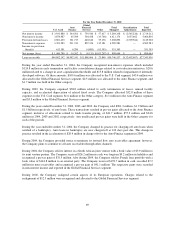
For the Year Ended December 31, 2003
U.S. Card
Auto
Finance
Global
Financial
Services Other
Total
Managed
Securitization
Adjustments
Total
Reported
Net interest income $ 4,287,814 $ 727,987 $ 1,072,098 $ (49,985) $ 6,037,914 $ (3,252,825) $ 2,785,089
Non-interest income 3,583,357 101,984 605,821 (90,536) 4,200,626 1,215,298 5,415,924
Provision for loan losses 2,647,406 382,952 595,543 (70,877) 3,555,024 (2,037,527) 1,517,497
Non-interest expenses 3,348,894 289,414 988,321 253,963 4,880,592 — 4,880,592
Income tax provision
(benefit) 693,702 58,314 29,216 (114,150) 667,082 — 667,082
Net income (loss) $ 1,181,169 $ 99,291 $ 64,839 $(209,457) $ 1,135,842 $ — $ 1,135,842
Loans receivable $46,278,750 $8,466,873 $16,507,937 $ (8,764) $71,244,796 $(38,394,527) $32,850,269
68