Capital One 2004 Annual Report Download - page 65
Download and view the complete annual report
Please find page 65 of the 2004 Capital One annual report below. You can navigate through the pages in the report by either clicking on the pages listed below, or by using the keyword search tool below to find specific information within the annual report.-
 1
1 -
2
-
3
-
4
-
5
-
6
-
7
-
8
-
9
-
10
-
11
-
12
-
13
-
14
-
15
-
16
-
17
-
18
-
19
-
20
-
21
-
22
-
23
-
24
-
25
-
26
-
27
-
28
-
29
-
30
-
31
-
32
-
33
-
34
-
35
-
36
-
37
-
38
-
39
-
40
-
41
-
42
-
43
-
44
-
45
-
46
-
47
-
48
-
49
-
50
-
51
-
52
-
53
-
54
-
 55
55 -
 56
56 -
 57
57 -
 58
58 -
 59
59 -
 60
60 -
 61
61 -
 62
62 -
 63
63 -
 64
64 -
 65
65 -
 66
66 -
 67
67 -
 68
68 -
 69
69 -
 70
70 -
 71
71 -
 72
72 -
 73
73 -
 74
74 -
 75
75 -
76
-
77
-
78
-
79
-
80
-
81
-
82
-
83
-
84
-
85
-
86
-
87
-
88
-
89
-
90
-
91
-
92
-
93
-
94
-
95
-
96
-
97
-
98
-
99
-
100
-
101
-
102
-
103
-
104
-
105
-
106
-
107
-
108
-
109
-
110
-
111
-
112
-
113
-
114
-
115
-
116
-
117
-
118
-
119
-
120
-
121
-
122
-
123
-
124
-
125
-
126
-
127
-
128
-
129
-
130
-
131
-
132
-
133
-
134
-
135
-
136
-
137
 |
 |

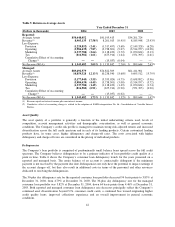
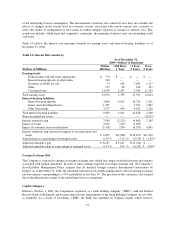
Table 5: Return on Average Assets
Year Ended December 31
(Dollars in thousands) 2004 2003 2002
Reported:
Average Assets $50,648,052 $41,195,413 $34,201,724
Revenue(1) 8,903,135 17.58% 8,201,013 19.91% 8,185,948 23.93%
Less Expense:
Provision (1,220,852) (2.41) (1,517,497) (3.68) (2,149,328) (6.28)
Operating (3,984,439) (7.87) (3,738,301) (9.07) (3,514,957) (10.28)
Marketing (1,337,780) (2.64) (1,118,422) (2.72) (1,070,624) (3.13)
Tax (816,582) (1.61) (675,914) (1.64) (551,395) (1.61)
Cumulative Effect of Accounting
Change(2) —— (15,037) (0.04) — —
Net Income (ROA) $ 1,543,482 3.05% $ 1,135,842 2.76% $ 899,644 2.63%
Managed:
Average Assets $89,492,579 $74,822,509 $61,411,901
Revenue(1) 10,859,328 12.13% 10,238,540 13.68% 9,695,512 15.79%
Less Expense:
Provision (3,177,045) (3.55) (3,555,024) (4.75) (3,658,892) (5.96)
Operating (3,984,439) (4.45) (3,738,301) (5.00) (3,514,957) (5.72)
Marketing (1,337,780) (1.49) (1,118,422) (1.49) (1,070,624) (1.74)
Tax (816,582) (0.91) (675,914) (0.90) (551,395) (0.90)
Cumulative Effect of Accounting
Change(2) —— (15,037) (0.02) — —
Net Income (ROA) $ 1,543,482 1.73% $ 1,135,842 1.52% $ 899,644 1.47%
(1) Revenue equals net interest income plus non-interest income.
(2) Cumulative effect of accounting change is related to the adoption of FASB interpretation No. 46, Consolidation of Variable Interest
Entities.
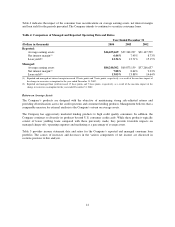
Asset Quality
The asset quality of a portfolio is generally a function of the initial underwriting criteria used, levels of
competition, account management activities and demographic concentration, as well as general economic
conditions. The Company’s credit risk profile is managed to maintain strong risk adjusted returns and increased
diversification across the full credit spectrum and in each of its lending products. Certain customized lending
products have, in some cases, higher delinquency and charge-off rates. The costs associated with higher
delinquency and charge-off rates are considered in the pricing of individual products.
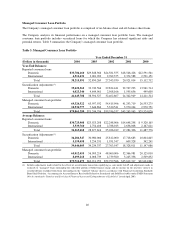
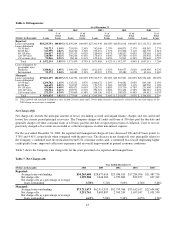
Delinquencies
The Company’s loan portfolio is comprised of predominantly small balance loans spread across the full credit
spectrum. The Company believes delinquencies to be a primary indicator of loan portfolio credit quality at a
point in time. Table 6 shows the Company’s consumer loan delinquency trends for the years presented on a
reported and managed basis. The entire balance of an account is contractually delinquent if the minimum
payment is not received by the payment due date. Delinquencies not only have the potential to impact earnings if
the account charges off, but they also result in additional costs in terms of the personnel and other resources
dedicated to resolving the delinquencies.
The 30-plus day delinquency rate for the reported consumer loan portfolio decreased 94 basis points to 3.85% at
December 31, 2004, from 4.79% at December 31, 2003. The 30-plus day delinquency rate for the managed
consumer loan portfolio was 3.82% at December 31, 2004, down 64 basis points from 4.46% at December 31,
2003. Both reported and managed consumer loan delinquency rate decreases principally reflect the Company’s
continued asset diversification beyond U.S. consumer credit cards, a continued bias toward originating higher
credit quality loans, improved collections experience and an overall improvement in general economic
conditions.
42