Capital One 2004 Annual Report Download - page 57
Download and view the complete annual report
Please find page 57 of the 2004 Capital One annual report below. You can navigate through the pages in the report by either clicking on the pages listed below, or by using the keyword search tool below to find specific information within the annual report.-
 1
1 -
2
-
3
-
4
-
5
-
6
-
7
-
8
-
9
-
10
-
11
-
12
-
13
-
14
-
15
-
16
-
17
-
18
-
19
-
20
-
21
-
22
-
23
-
24
-
25
-
26
-
27
-
28
-
29
-
30
-
31
-
32
-
33
-
34
-
35
-
36
-
37
-
38
-
39
-
40
-
41
-
42
-
43
-
44
-
45
-
46
-
 47
47 -
 48
48 -
 49
49 -
 50
50 -
 51
51 -
 52
52 -
 53
53 -
 54
54 -
 55
55 -
 56
56 -
 57
57 -
 58
58 -
 59
59 -
 60
60 -
 61
61 -
 62
62 -
 63
63 -
 64
64 -
 65
65 -
 66
66 -
 67
67 -
68
-
69
-
70
-
71
-
72
-
73
-
74
-
75
-
76
-
77
-
78
-
79
-
80
-
81
-
82
-
83
-
84
-
85
-
86
-
87
-
88
-
89
-
90
-
91
-
92
-
93
-
94
-
95
-
96
-
97
-
98
-
99
-
100
-
101
-
102
-
103
-
104
-
105
-
106
-
107
-
108
-
109
-
110
-
111
-
112
-
113
-
114
-
115
-
116
-
117
-
118
-
119
-
120
-
121
-
122
-
123
-
124
-
125
-
126
-
127
-
128
-
129
-
130
-
131
-
132
-
133
-
134
-
135
-
136
-
137
 |
 |
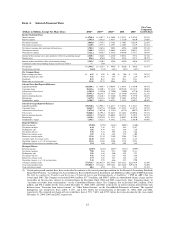
December 31, 2004. The improvements in the Company’s credit quality metrics are a result of the continued
asset diversification beyond U.S consumer credit cards, continued bias toward originating higher credit quality,
lower yielding loans, improved collection experience and an overall improvement in general economic
conditions compared with the prior year.
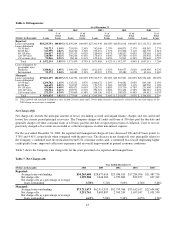
Servicing and securitization income increased $432.1 million as a result of a 16% increase in the average off-
balance sheet loan portfolio for the year ended December 31, 2004 when compared with the prior year, partially
offset by a reduction in the excess spread generated by the off-balance sheet portfolio due to a higher
concentration of higher credit quality, lower yielding loans.
For the year ended December 31, 2004, other non-interest income increased $100.6 million, or 51%, when
compared to the prior year. This increase is primarily attributable to $72.6 million in pre-tax gains recognized in
2004 on the sale of the Company’s joint venture investment in South Africa and sale of the French loan portfolio.
The remaining variance is due to increases in income derived from purchased charged-off loan portfolios,
slightly offset by a decrease in auto gains and an increase in losses on sales of securities available for sale and
losses on the repurchases of senior notes during 2004.
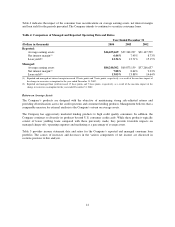
Marketing expense increased $219.4 million, or 20%, to $1.3 billion for the year ended December 31, 2004,
compared to the prior year. The increase in marketing expense resulted from favorable opportunities to originate
loans during 2004 combined with continued brand investments. Operating expenses increased $246.1 million, or
7%, for the year ended December 31, 2004 to $4.0 billion from $3.7 billion for the prior year. The increases were
primarily related to charges associated with corporate-wide cost reduction initiatives, charges related to a change
in asset capitalization thresholds and charges related to the impairment of internally developed software.
Although operating expenses increased, operating expenses as a percentage of average managed loans for the
year ended December 31, 2004 fell 53 basis points to 5.41% from 5.94% for the prior year. This reduction
reflects the continued improvement in the Company’s operating efficiencies.
Year Ended December 31, 2003 Compared to Year Ended December 31, 2002
Net income increased to $1.1 billion, or $4.85 per share, for the year ended December 31, 2003, compared to net
income of $899.6 million, or $3.93 per share, in 2002. This represents 26% net income growth and 23% earnings
per share growth in 2003. The growth in earnings for 2003 was primarily attributable to the growth in the
Company’s managed loan portfolio, a reduction in the provision for loan losses and increases in the sales of auto
loans, offset in part by the adoption of new accounting pronouncements (discussed above), a reduction in the
managed net interest margin, net losses on the sale of securities and increases in marketing and operating
expenses.
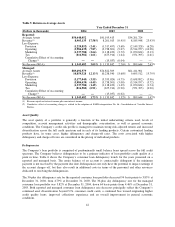
Managed loans consist of the Company’s reported loan portfolio combined with the off-balance sheet securitized
loan portfolio. The Company has retained servicing rights for its securitized loans and receives servicing fees in
addition to the excess spread generated from the off-balance sheet loan portfolio. Average managed loans
increased $10.1 billion, or 19%, to $62.9 billion for 2003 from $52.8 billion for 2002.
The managed net interest margin for the year ended December 31, 2003, decreased to 8.64% from 9.23% for the
year ended December 31, 2002. This decrease was due to a reduction in managed earning asset yields. Managed
loan yields decreased by 76 basis points to 13.88% for the year ended December 31, 2003, from 14.64%
compared to the prior year. The decrease in managed loan yields resulted from the shift in the mix of the
managed loan portfolio to higher credit quality, lower yielding loans, an increase in low introductory rate
accounts compared to the prior year and reduced pricing on many of the Company’s new loans in response to
lower funding costs and increased competitive pressure. In addition, the Company built its average liquidity
portfolio by $2.5 billion to $7.0 billion in 2003, from $4.5 billion in 2002, placing additional downward pressure
on managed earning asset yields.
34