Capital One 2004 Annual Report Download - page 59
Download and view the complete annual report
Please find page 59 of the 2004 Capital One annual report below. You can navigate through the pages in the report by either clicking on the pages listed below, or by using the keyword search tool below to find specific information within the annual report.-
 1
1 -
2
-
3
-
4
-
5
-
6
-
7
-
8
-
9
-
10
-
11
-
12
-
13
-
14
-
15
-
16
-
17
-
18
-
19
-
20
-
21
-
22
-
23
-
24
-
25
-
26
-
27
-
28
-
29
-
30
-
31
-
32
-
33
-
34
-
35
-
36
-
37
-
38
-
39
-
40
-
41
-
42
-
43
-
44
-
45
-
46
-
47
-
48
-
 49
49 -
 50
50 -
 51
51 -
 52
52 -
 53
53 -
 54
54 -
 55
55 -
 56
56 -
 57
57 -
 58
58 -
 59
59 -
 60
60 -
 61
61 -
 62
62 -
 63
63 -
 64
64 -
 65
65 -
 66
66 -
 67
67 -
 68
68 -
 69
69 -
70
-
71
-
72
-
73
-
74
-
75
-
76
-
77
-
78
-
79
-
80
-
81
-
82
-
83
-
84
-
85
-
86
-
87
-
88
-
89
-
90
-
91
-
92
-
93
-
94
-
95
-
96
-
97
-
98
-
99
-
100
-
101
-
102
-
103
-
104
-
105
-
106
-
107
-
108
-
109
-
110
-
111
-
112
-
113
-
114
-
115
-
116
-
117
-
118
-
119
-
120
-
121
-
122
-
123
-
124
-
125
-
126
-
127
-
128
-
129
-
130
-
131
-
132
-
133
-
134
-
135
-
136
-
137
 |
 |

Company’s earning assets for the year ended December 31, 2003 compared to the prior year, offset by a decrease in earning
asset yields. The reported net interest margin was 7.45% for the year ended December 31, 2003 compared to 8.73% for the
prior year. Excluding the one-time impact of the change in recoveries estimate of 12 basis points, the net interest margin
decreased 116 basis points for the year ended December 31, 2003. The decrease was primarily due to a decrease in the
reported loan yield. The reported loan yield decreased 144 basis points to 13.71% for the year ended December 31, 2003,
compared to 15.15% for the year ended December 31, 2002. The yield on reported loans decreased due to a shift in the mix
of the reported loan portfolio towards a greater composition of lower yielding, higher credit quality loans and an increase in
low introductory rate accounts compared to the prior year. In addition, the Company increased its average liquidity portfolio
by $2.5 billion during 2003. The yield on liquidity portfolio assets is significantly lower than those on consumer loans and
served to reduce the overall earning assets yields.
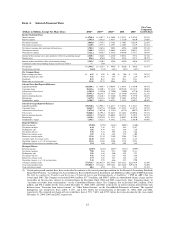
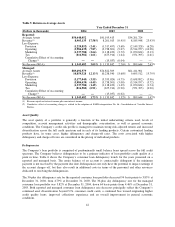
Table 1 provides average balance sheet data and an analysis of net interest income, net interest spread (the difference
between the yield on earning assets and the cost of interest-bearing liabilities) and net interest margin for each of the years
ended December 31, 2004, 2003 and 2002.
Table 1: Statements of Reported Average Balances, Income and Expense, Yields and Rates
Year Ended December 31
2004 2003 2002
(Dollars in thousands) Average
Balance Income/
Expense Yield/
Rate Average
Balance Income/
Expense Yield/
Rate Average
Balance Income/
Expense Yield/
Rate
Assets:
Earning assets
Consumer loans(1)
Domestic $30,725,908 $3,844,036 12.51%$25,923,208 $3,578,994 13.81% $22,248,006 $3,436,392 15.45%
International 3,539,760 390,384 11.03% 2,754,408 353,301 12.83% 2,788,013 356,069 12.77%
Total consumer loans 34,265,668 4,234,420 12.36% 28,677,616 3,932,295 13.71% 25,036,019 3,792,461 15.15%
Securities available for sale 8,879,785 312,374 3.52% 5,335,492 192,594 3.61% 3,873,186 184,407 4.76%
Other
Domestic 2,577,403 192,901 7.48% 2,836,531 215,957 7.61% 1,951,996 187,230 9.59%
International 932,813 54,725 5.87% 512,658 26,808 5.23% 286,398 16,668 5.82%
Total Other 3,510,216 247,626 7.05% 3,349,189 242,765 7.25% 2,238,394 203,898 9.11%
Total earning assets 46,655,669 $4,794,420 10.28% 37,362,297 $4,367,654 11.69% 31,147,599 $4,180,766 13.42%
Cash and due from banks 506,483 387,167 507,355
Allowance for loan losses (1,473,003) (1,627,020) (1,178,243)
Premises and equipment, net 874,960 833,343 802,544
Other 4,083,943 4,239,626 2,922,469
Total assets $50,648,052 $41,195,413 $34,201,724
Liabilities and Equity:
Interest-bearing liabilities
Deposits
Domestic $22,517,293 $ 916,343 4.07%$18,550,273 $ 817,515 4.41%$14,650,582 $ 748,809 5.11%
International 1,795,996 93,202 5.19% 1,217,690 74,135 6.09% 956,360 63,080 6.60%
Total Deposits 24,313,289 1,009,545 4.15% 19,767,963 891,650 4.51% 15,606,942 811,889 5.20%
Senior and subordinated notes 7,203,423 486,812 6.76% 5,915,300 423,826 7.16% 5,668,343 408,205 7.20%
Other borrowings
Domestic 8,518,817 295,029 3.46% 7,061,192 267,066 3.78% 5,689,369 240,530 4.23%
International 1,360 56 4.12% 1,532 23 1.50% 23,350 1,030 4.41%
Total Other borrowings 8,520,177 295,085 3.46% 7,062,724 267,089 3.78% 5,712,719 241,560 4.23%
Total interest-bearing liabilities 40,036,889 $1,791,442 4.47% 32,745,987 $1,582,565 4.83% 26,988,004 $1,461,654 5.42%
Other 3,315,616 3,125,956 3,065,570
Total liabilities 43,352,505 35,871,943 30,053,574
Equity 7,295,547 5,323,470 4,148,150
Total liabilities and equity $50,648,052 $41,195,413 $34,201,724
Net interest spread 5.81% 6.86% 8.00%
Interest income to average earning
assets 10.28% 11.69% 13.42%
Interest expense to average earning
assets 3.84% 4.24% 4.69%
Net interest margin 6.44% 7.45% 8.73%
(1) Interest income includes past-due fees on loans of approximately $792.0 million, $799.3 million and $955.8 million for the years
ended December 31, 2004, 2003 and 2002, respectively. Interest income includes $38.4 million related to the one-time impact of the
change in recoveries assumption for the year ended December 31, 2002. This resulted in a 12 basis point increase in the net interest
margin.
36