Capital One 2004 Annual Report Download - page 117
Download and view the complete annual report
Please find page 117 of the 2004 Capital One annual report below. You can navigate through the pages in the report by either clicking on the pages listed below, or by using the keyword search tool below to find specific information within the annual report.-
 1
1 -
2
-
3
-
4
-
5
-
6
-
7
-
8
-
9
-
10
-
11
-
12
-
13
-
14
-
15
-
16
-
17
-
18
-
19
-
20
-
21
-
22
-
23
-
24
-
25
-
26
-
27
-
28
-
29
-
30
-
31
-
32
-
33
-
34
-
35
-
36
-
37
-
38
-
39
-
40
-
41
-
42
-
43
-
44
-
45
-
46
-
47
-
48
-
49
-
50
-
51
-
52
-
53
-
54
-
55
-
56
-
57
-
58
-
59
-
60
-
61
-
62
-
63
-
64
-
65
-
66
-
67
-
68
-
69
-
70
-
71
-
72
-
73
-
74
-
75
-
76
-
77
-
78
-
79
-
80
-
81
-
82
-
83
-
84
-
85
-
86
-
87
-
88
-
89
-
90
-
91
-
92
-
93
-
94
-
95
-
96
-
97
-
98
-
99
-
100
-
101
-
102
-
103
-
104
-
105
-
106
-
 107
107 -
 108
108 -
 109
109 -
 110
110 -
 111
111 -
 112
112 -
 113
113 -
 114
114 -
 115
115 -
 116
116 -
 117
117 -
 118
118 -
 119
119 -
 120
120 -
 121
121 -
 122
122 -
 123
123 -
 124
124 -
 125
125 -
 126
126 -
 127
127 -
128
-
129
-
130
-
131
-
132
-
133
-
134
-
135
-
136
-
137
 |
 |

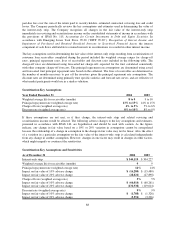
respective dates, taking into account the forward yield curve on the swaps and the forward rates on the currency
swaps and f/x contracts. These derivatives are included in other liabilities on the balance sheet.
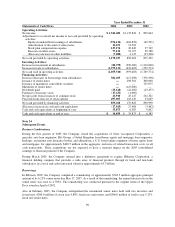
2004 2003
Carrying
Amount
Estimated
Fair Value
Carrying
Amount
Estimated
Fair Value
Financial Assets
Cash and cash equivalents $ 1,411,211 $ 1,411,211 $ 1,980,282 $ 1,980,282
Securities available for sale 9,300,454 9,300,454 5,866,628 5,866,628
Net loans 36,710,591 37,010,417 31,255,269 31,571,269
Interest receivable 252,857 252,857 214,295 214,295
Accounts receivable from securitization 4,081,271 4,081,271 4,748,962 4,748,962
Derivatives 243,594 243,594 338,549 338,549
Financial Liabilities
Interest-bearing deposits $25,636,802 $25,882,189 $22,416,332 $23,138,228
Senior and subordinated notes 6,874,790 7,199,186 7,016,020 7,423,326
Other borrowings 9,637,019 9,621,173 7,796,613 7,793,758
Interest payable 237,227 237,227 256,015 256,015
Derivatives 427,012 427,012 481,228 481,228
Note 22
International Activities
The Company’s international activities are primarily performed through Capital One Bank (Europe) plc, a
subsidiary bank of the Bank that provides consumer lending and other financial products in Europe and Capital
One Bank—Canada Branch, a foreign branch office of the Bank that provides consumer lending products in
Canada. The total assets, revenue, income before income taxes and net income of the international operations are
summarized below.
2004 2003 2002
Domestic
Total Assets $48,117,413 $42,230,859 $34,420,099
Revenue(1) 7,873,218 7,461,825 7,604,075
Income before income taxes and cumulative accounting change 2,118,067 1,736,362 1,436,706
Net Income 1,369,082 1,090,296 899,429
International
Total Assets 5,629,842 4,052,847 2,962,281
Revenue(1) 1,029,917 739,188 581,873
Income before income taxes and cumulative accounting change 241,997 90,431 14,333
Net Income 174,400 45,546 215
Total Company
Total Assets $53,747,255 $46,283,706 $37,382,380
Revenue(1) 8,903,135 8,201,013 8,185,948
Income before income taxes and cumulative accounting change 2,360,064 1,826,793 1,451,039
Net Income 1,543,482 1,135,842 899,644
(1) Revenue equals net interest income plus non-interest income.
94