Capital One 2004 Annual Report Download - page 50
Download and view the complete annual report
Please find page 50 of the 2004 Capital One annual report below. You can navigate through the pages in the report by either clicking on the pages listed below, or by using the keyword search tool below to find specific information within the annual report.-
 1
1 -
2
-
3
-
4
-
5
-
6
-
7
-
8
-
9
-
10
-
11
-
12
-
13
-
14
-
15
-
16
-
17
-
18
-
19
-
20
-
21
-
22
-
23
-
24
-
25
-
26
-
27
-
28
-
29
-
30
-
31
-
32
-
33
-
34
-
35
-
36
-
37
-
38
-
39
-
 40
40 -
 41
41 -
 42
42 -
 43
43 -
 44
44 -
 45
45 -
 46
46 -
 47
47 -
 48
48 -
 49
49 -
 50
50 -
 51
51 -
 52
52 -
 53
53 -
 54
54 -
 55
55 -
 56
56 -
 57
57 -
 58
58 -
 59
59 -
 60
60 -
61
-
62
-
63
-
64
-
65
-
66
-
67
-
68
-
69
-
70
-
71
-
72
-
73
-
74
-
75
-
76
-
77
-
78
-
79
-
80
-
81
-
82
-
83
-
84
-
85
-
86
-
87
-
88
-
89
-
90
-
91
-
92
-
93
-
94
-
95
-
96
-
97
-
98
-
99
-
100
-
101
-
102
-
103
-
104
-
105
-
106
-
107
-
108
-
109
-
110
-
111
-
112
-
113
-
114
-
115
-
116
-
117
-
118
-
119
-
120
-
121
-
122
-
123
-
124
-
125
-
126
-
127
-
128
-
129
-
130
-
131
-
132
-
133
-
134
-
135
-
136
-
137
 |
 |

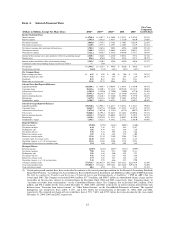
Item 6. Selected Financial Data
(Dollars in Millions, Except Per Share Data) 2004(1) 2003(1) 2002(1) 2001 2000
Five Year
Compound
Growth Rate
Income Statement Data:
Interest income $ 4,794.4 $ 4,367.7 $ 4,180.8 $ 2,921.1 $ 2,453.9 24.19%
Interest expense 1,791.4 1,582.6 1,461.7 1,171.0 801.0 27.06%
Net interest income 3,003.0 2,785.1 2,719.1 1,750.1 1,652.9 22.65%
Provision for loan losses 1,220.9 1,517.5 2,149.3 1,120.5 812.9 23.41%
Net interest income after provision for loan losses 1,782.1 1,267.6 569.8 629.6 840.0 22.14%
Non-interest income 5,900.2 5,415.9 5,466.8 4,463.8 3,065.1 19.85%
Non-interest expense 5,322.2 4,856.7 4,585.6 4,058.0 3,147.7 16.64%
Income before income taxes and cumulative effect of accounting change 2,360.1 1,826.8 1,451.0 1,035.4 757.4 32.54%
Income taxes 816.6 676.0 551.4 393.4 287.8 30.72%
Income before cumulative effect of accounting change 1,543.5 1,150.8 899.6 642.0 469.6 33.57%
Cumulative effect of accounting change, net of taxes of $8.8 —15.0 — — —
Net income $ 1,543.5 $ 1,135.8 $ 899.6 $ 642.0 $ 469.6 33.57%
Dividend payout ratio 1.66% 2.14% 2.61% 3.48% 4.43%
Per Common Share:
Basic earnings per share $6.55$ 5.05 $ 4.09 $ 3.06 $ 2.39 28.91%
Diluted earnings per share 6.21 4.85 3.93 2.91 2.24 29.27%
Dividends 0.11 0.11 0.11 0.11 0.11
Book value as of year-end 33.99 25.75 20.44 15.33 9.94
Selected Year-End Reported Balances:
Liquidity portfolio $10,384.1 $ 7,464.7 $ 5,064.9 $ 3,467.4 $ 1,859.0 39.45%
Consumer loans 38,215.6 32,850.3 27,343.9 20,921.0 15,112.7 30.98%
Allowance for loan losses (1,505.0) (1,595.0) (1,720.0) (840.0) (527.0) 34.49%
Total assets 53,747.3 46,283.7 37,382.4 28,184.0 18,889.3 32.15%
Interest-bearing deposits 25,636.8 22,416.3 17,326.0 12,839.0 8,379.0 46.62%
Borrowings 9,637.0 14,812.6 11,930.7 9,330.8 6,976.5 6.72%
Stockholders’ equity 8,388.2 6,051.8 4,623.2 3,323.5 1,962.5 40.80%
Selected Average Reported Balances:
Liquidity portfolio $10,528.6 $ 6,961.2 $ 4,467.7 $ 3,038.4 $ 1,764.3 39.03%
Consumer loans 34,265.7 28,677.6 25,036.0 17,284.3 11,487.8 34.91%
Allowance for loan losses (1,473.0) (1,627.0) (1,178.2) (637.8) (402.2) 40.47%
Total assets 50,648.1 41,195.4 34,201.7 23,346.3 15,209.6 35.51%
Interest-bearing deposits 24,313.3 19,768.0 15,606.9 10,373.5 5,339.5 54.51%
Borrowings 8,520.2 12,978.0 11,381.1 8,056.7 6,870.0 6.99%
Stockholders’ equity 7,295.5 5,323.5 4,148.2 2,781.2 1,701.0 38.96%
Reported Metrics:
Revenue margin 19.08% 21.95% 26.28% 30.01% 35.60%
Net interest margin 6.44 7.45 8.73 8.45 12.47
Delinquency rate 3.85 4.79 6.12 4.84 7.26
Net charge-off rate 3.78 5.74 5.03 4.76 5.46
Return on average assets 3.05 2.76 2.63 2.75 3.09
Return on average equity 21.16 21.34 21.69 23.08 27.61
Average equity to average assets 14.40 12.92 12.13 11.91 11.18
Operating expense as a % of average loans 11.63 13.04 14.04 17.21 19.51
Allowance for loan losses to consumer loans 3.94 4.86 6.29 4.02 3.49
Managed Metrics:
Revenue margin 12.89% 14.65% 16.93% 18.23% 20.99%
Net interest margin 7.88 8.64 9.23 9.40 11.11
Delinquency rate 3.82 4.46 5.60 4.95 5.23
Net charge-off rate 4.41 5.86 5.24 4.65 4.56
Return on average assets 1.73 1.52 1.47 1.54 1.78
Operating expense as a % of average loans 5.41 5.94 6.66 8.35 9.90
Average consumer loans $73,711.7 $62,911.9 $52,799.6 $35,612.3 $22,634.9 32.50%
Year-end consumer loans $79,861.3 $71,244.8 $59,746.5 $45,264.0 $29,524.0 31.60%
Year-end total accounts 48.6 47.0 47.4 43.8 33.8 15.43%
(1) Certain prior period amounts have been reclassified to conform to the current period presentation for the Financial Accounting Standards
Board Staff Position, “Accounting for Accrued Interest Receivable Related to Securitized and Sold Receivables under FASB Statement
No. 140, Accounting for Transfers and Servicing of Financial Assets and Extinguishments of Liabilities”, (“FSP on AIR”) that was
issued April 2003. The Company reclassified $460.6 million, $577.0 million, and $509.7 million in subordinated finance charge and fee
receivables on the investors’ interest in securitized loans for December 2004, 2003 and 2002, respectively, from “Consumer loans” to
“Accounts receivable from securitizations” on the Consolidated Balance Sheet. The Company also reclassified $69.2 million, $74.8
million, and $76.2 million for the years ended December 31, 2004, 2003, and 2002, respectively, in interest income derived from such
balances from “Consumer loan interest income” to “Other Interest Income” on the Consolidated Statements of Income. The reported
delinquency rate would have been 4.08%, 5.13%, and 6.51% before the reclassification at December 31, 2004, 2003 and 2002,
respectively. The reported net charge-off rate would have been 3.73%, 5.64% and 4.93% before the reclassification for the years ended
December 31, 2004, 2003 and 2002, respectively.
27