Capital One 2004 Annual Report Download - page 93
Download and view the complete annual report
Please find page 93 of the 2004 Capital One annual report below. You can navigate through the pages in the report by either clicking on the pages listed below, or by using the keyword search tool below to find specific information within the annual report.-
 1
1 -
2
-
3
-
4
-
5
-
6
-
7
-
8
-
9
-
10
-
11
-
12
-
13
-
14
-
15
-
16
-
17
-
18
-
19
-
20
-
21
-
22
-
23
-
24
-
25
-
26
-
27
-
28
-
29
-
30
-
31
-
32
-
33
-
34
-
35
-
36
-
37
-
38
-
39
-
40
-
41
-
42
-
43
-
44
-
45
-
46
-
47
-
48
-
49
-
50
-
51
-
52
-
53
-
54
-
55
-
56
-
57
-
58
-
59
-
60
-
61
-
62
-
63
-
64
-
65
-
66
-
67
-
68
-
69
-
70
-
71
-
72
-
73
-
74
-
75
-
76
-
77
-
78
-
79
-
80
-
81
-
82
-
 83
83 -
 84
84 -
 85
85 -
 86
86 -
 87
87 -
 88
88 -
 89
89 -
 90
90 -
 91
91 -
 92
92 -
 93
93 -
 94
94 -
 95
95 -
 96
96 -
 97
97 -
 98
98 -
 99
99 -
 100
100 -
 101
101 -
 102
102 -
 103
103 -
104
-
105
-
106
-
107
-
108
-
109
-
110
-
111
-
112
-
113
-
114
-
115
-
116
-
117
-
118
-
119
-
120
-
121
-
122
-
123
-
124
-
125
-
126
-
127
-
128
-
129
-
130
-
131
-
132
-
133
-
134
-
135
-
136
-
137
 |
 |

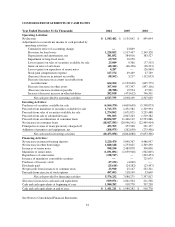
The $15.0 million ($23.9 million pre-tax) charge for the cumulative effect of a change in accounting principle
related to the adoption of FIN 46 was included in non-interest expense and reported in the Other category for
segment reporting for the year ended December 31, 2003.
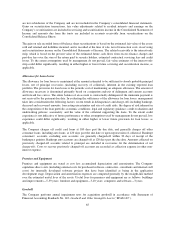
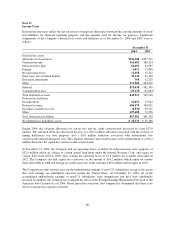
Note 3
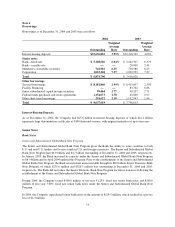
Securities Available for Sale
Securities available for sale as of December 31, 2004, 2003 and 2002 were as follows:
Maturity Schedule
1Year
or Less 1–5 Years 5–10 Years
Over
10 Years
Market
Value Totals
Amortized
Cost Totals
December 31, 2004
U.S. Treasury and other U.S. government
agency obligations $ 324,888 $3,335,853 $ 801,448 $ — $4,462,189 $4,492,021
Collateralized mortgage obligations 138,734 3,194,358 73,375 72,883 3,479,350 3,495,207
Mortgage backed securities — 1,163,943 — 55,688 1,219,631 1,220,577
Other 24,815 389 1,052 113,028 139,284 134,558
Total $ 488,437 $7,694,543 $ 875,875 $241,599 $9,300,454 $9,342,363
December 31, 2003
U.S. Treasury and other U.S. government
agency obligations $ 792,926 $1,066,342 $1,082,814 $ — $2,942,082 $2,920,310
Collateralized mortgage obligations 270,637 1,681,920 10,718 — 1,963,275 1,958,782
Mortgage backed securities 24,676 851,237 — — 875,913 871,062
Other 3,958 507 — 80,893 85,358 81,710
Total $1,092,197 $3,600,006 $1,093,532 $ 80,893 $5,866,628 $5,831,864
Unrealized gains (losses) on securities included gross unrealized gains of $28.2 million, $43.0 million and $80.6
million, and gross unrealized losses of $70.3 million, $11.6 million and $.4 million, as of December 31, 2004,
2003 and 2002, respectively.
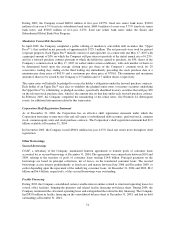
The following table shows the Company’s investments’ gross unrealized losses and fair value of the investments
in an unrealized loss position, aggregated by investment category, at December 31, 2004 and 2003.
Less than
12 Months
Greater than
12 Months Total
Fair Value
Unrealized
Losses
Fair
Value
Unrealized
Losses Fair Value
Unrealized
Losses
December 31, 2004
U.S. Treasury and other U.S. government
agency obligations $3,243,505 $39,883 $ 89,608 $ 5 $3,333,113 $39,888
Collateralized mortgage obligations 2,116,482 20,411 143,364 3,184 2,259,846 23,595
Mortgage backed securities 600,394 4,723 84,016 2,032 684,410 6,755
Other 4,156 29 — — 4,156 29
Total $5,964,537 $65,046 $316,988 $5,221 $6,281,525 $70,267
December 31, 2003
U.S. Treasury and other U.S. government
agency obligations $ 559,090 $ 3,695 $ — $ — $ 559,090 $ 3,695
Collateralized mortgage obligations 795,122 5,085 — — 795,122 5,085
Mortgage backed securities 233,112 2,822 — — 233,112 2,822
Other 5,001 26 — — 5,001 26
Total $1,592,325 $11,628 $ — $ — $1,592,325 $11,628
70