Capital One 2004 Annual Report Download - page 68
Download and view the complete annual report
Please find page 68 of the 2004 Capital One annual report below. You can navigate through the pages in the report by either clicking on the pages listed below, or by using the keyword search tool below to find specific information within the annual report.-
 1
1 -
2
-
3
-
4
-
5
-
6
-
7
-
8
-
9
-
10
-
11
-
12
-
13
-
14
-
15
-
16
-
17
-
18
-
19
-
20
-
21
-
22
-
23
-
24
-
25
-
26
-
27
-
28
-
29
-
30
-
31
-
32
-
33
-
34
-
35
-
36
-
37
-
38
-
39
-
40
-
41
-
42
-
43
-
44
-
45
-
46
-
47
-
48
-
49
-
50
-
51
-
52
-
53
-
54
-
55
-
56
-
57
-
 58
58 -
 59
59 -
 60
60 -
 61
61 -
 62
62 -
 63
63 -
 64
64 -
 65
65 -
 66
66 -
 67
67 -
 68
68 -
 69
69 -
 70
70 -
 71
71 -
 72
72 -
 73
73 -
 74
74 -
 75
75 -
 76
76 -
 77
77 -
 78
78 -
79
-
80
-
81
-
82
-
83
-
84
-
85
-
86
-
87
-
88
-
89
-
90
-
91
-
92
-
93
-
94
-
95
-
96
-
97
-
98
-
99
-
100
-
101
-
102
-
103
-
104
-
105
-
106
-
107
-
108
-
109
-
110
-
111
-
112
-
113
-
114
-
115
-
116
-
117
-
118
-
119
-
120
-
121
-
122
-
123
-
124
-
125
-
126
-
127
-
128
-
129
-
130
-
131
-
132
-
133
-
134
-
135
-
136
-
137
 |
 |

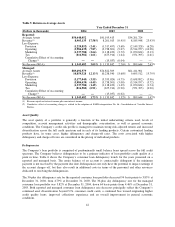
December 31, 2004, down 94 basis points from December 31, 2003 and the reported charge-off rate which was
3.78% for the year ended December 31, 2004, down 196 basis points from the prior year.
For the year ended December 31, 2003, the provision for loan losses decreased to $1.5 billion, or 29%, from $2.1
billion for the year ended December 31, 2002. This decrease resulted from the improving credit quality of the
reported loan portfolio. The 30-plus day reported delinquency rate was 4.79% at December 31, 2003, down from
6.12% at December 31, 2002. While, the Company’s reported loan portfolio increased to $32.9 billion at
December 31, 2003 from $27.3 billion at December 31, 2002, the impact of the loan growth to the allowance was
mitigated by the growth being concentrated in higher credit quality loans and an improvement in collection
experience.
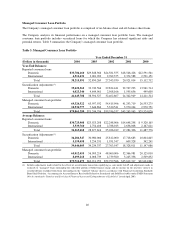
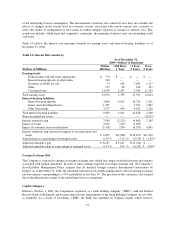
Reportable Segments
The Company manages its business by three distinct operating segments: U.S. Card, Auto Finance and Global
Financial Services. The U.S. Card, Auto Finance and Global Financial Services segments are considered
reportable segments based on quantitative thresholds applied to the managed loan portfolio for reportable
segments provided by SFAS No. 131, Disclosures about Segments of an Enterprise and Related Information.
Management decision making is performed on a managed portfolio basis, and such information about reportable
segments is provided on a managed basis.
The Company maintains its books and records on a legal entity basis for the preparation of financial statements in
conformity with GAAP. The following table presents information prepared from the Company’s internal
management information system, which is maintained on a line of business level through allocations from the
consolidated financial results.
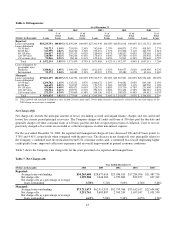
Table 9: Segments (Managed Basis)
U.S. Card Auto Finance Global Financial Services
(Dollars in thousands) 2004 2003 2004 2003 2004 2003
Loans receivable $48,609,571 $46,278,750 $9,997,497 $8,466,873 $21,240,325 $16,507,937
Net income 1,387,301 1,181,169 163,780 99,291 213,080 64,839
Net charge-off rate 5.05% 6.88% 3.28% 4.62% 3.39% 3.83%
30+ Delinquency rate 3.97 4.60 5.50 7.55 2.81 2.70
U.S. Card Segment
The U.S. Card segment consists of domestic credit card lending activities. Total U.S. Card segment loans
increased 5% to $48.6 billion at December 31, 2004, compared to $46.3 billion at December 31, 2003. The
Company achieved loan growth in this highly competitive segment by continuing to develop innovative new
products and leverage its brand. The contribution to net income from the U.S. Card segment increased $206.1
million, or 17%, to $1.4 billion for the year ended December 31, 2004 when compared with the prior year. The
increase in net income is attributable to growth in the loan portfolio, improving credit quality and operating
efficiencies, partially offset by $62.1 million in after-tax severance and facility consolidation charges related to
cost reduction initiatives and $9.6 million in after-tax charges related to a change in asset capitalization
thresholds allocated to the U.S. Card segment during 2004.
The U.S. Card segment’s net charge-off rate decreased 183 basis points to 5.05% for the year ended December
31, 2004 when compared with the prior year. The reduction in the net charge-off rate resulted from a decrease in
net charge-offs of $527.2 million, or 19%, while average U.S. Card segment loans grew 11% during 2004. The
decrease in net charge-offs was driven by the Company’s continued bias toward originating higher credit quality
loans, improved collections experience and an overall improvement in general economic conditions.
45