Capital One 2004 Annual Report Download - page 19
Download and view the complete annual report
Please find page 19 of the 2004 Capital One annual report below. You can navigate through the pages in the report by either clicking on the pages listed below, or by using the keyword search tool below to find specific information within the annual report.-
 1
1 -
2
-
3
-
4
-
5
-
6
-
7
-
8
-
 9
9 -
 10
10 -
 11
11 -
 12
12 -
 13
13 -
 14
14 -
 15
15 -
 16
16 -
 17
17 -
 18
18 -
 19
19 -
 20
20 -
 21
21 -
 22
22 -
 23
23 -
 24
24 -
 25
25 -
 26
26 -
 27
27 -
 28
28 -
 29
29 -
30
-
31
-
32
-
33
-
34
-
35
-
36
-
37
-
38
-
39
-
40
-
41
-
42
-
43
-
44
-
45
-
46
-
47
-
48
-
49
-
50
-
51
-
52
-
53
-
54
-
55
-
56
-
57
-
58
-
59
-
60
-
61
-
62
-
63
-
64
-
65
-
66
-
67
-
68
-
69
-
70
-
71
-
72
-
73
-
74
-
75
-
76
-
77
-
78
-
79
-
80
-
81
-
82
-
83
-
84
-
85
-
86
-
87
-
88
-
89
-
90
-
91
-
92
-
93
-
94
-
95
-
96
-
97
-
98
-
99
-
100
-
101
-
102
-
103
-
104
-
105
-
106
-
107
-
108
-
109
-
110
-
111
-
112
-
113
-
114
-
115
-
116
-
117
-
118
-
119
-
120
-
121
-
122
-
123
-
124
-
125
-
126
-
127
-
128
-
129
-
130
-
131
-
132
-
133
-
134
-
135
-
136
-
137
 |
 |

Capital One has grown rapidly, but we’ve always emphasized quality
over quantity. In our view, the big story is not that our managed loans
increased twelvefold in ten years or that we’ve become one of the
largest consumer franchises in America. The measure that matters
most to us is the year-in, year-out strength of our returns. Our annual
gains in earnings per share averaged 29% over the past 10 years –
almost three times more than the S&P 500SM during the same period.
And at 24%, Capital One’s average annual return on equity for the
decade exceeds the 15% for the S&P 500.
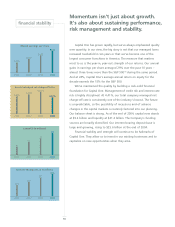
We’ve maintained the quality by building a rock-solid financial
foundation for Capital One. Management of credit risk and interest-rate
risk is highly disciplined. At 4.41%, our total company managed net
charge-off rate is consistently one of the industry’s lowest. The future
is unpredictable, so the possibility of recessions and of adverse
changes in the capital markets is routinely factored into our planning.
Our balance sheet is strong. As of the end of 2004, capital now stands
at $9.2 billion and liquidity at $21.2 billion. The Company’s funding
sources are broadly diversified. Our interest-bearing deposit base is
large and growing, rising to $25.6 billion at the end of 2004.
Financial stability and strength will continue to be hallmarks of
Capital One. They allow us to invest in our existing businesses and to
capitalize on new opportunities when they arise.
Momentum isn’t just about growth.
It’s also about sustaining performance,
risk management and stability.
16
financial stability
diluted earnings per share
2004200320022001
$6.21
$4.85
$3.93
$2.91
annual managed net charge-off rate
2004200320022001
4.65% 5.24%
5.86%
4.41%
capital ($ in millions)
2004200320022001
$3
$5
$7
$9
bank & FSB deposits ($ in billions)
2004
$26
2003
$22
2002
$17
2001
$13