Capital One 2004 Annual Report Download - page 69
Download and view the complete annual report
Please find page 69 of the 2004 Capital One annual report below. You can navigate through the pages in the report by either clicking on the pages listed below, or by using the keyword search tool below to find specific information within the annual report.-
 1
1 -
2
-
3
-
4
-
5
-
6
-
7
-
8
-
9
-
10
-
11
-
12
-
13
-
14
-
15
-
16
-
17
-
18
-
19
-
20
-
21
-
22
-
23
-
24
-
25
-
26
-
27
-
28
-
29
-
30
-
31
-
32
-
33
-
34
-
35
-
36
-
37
-
38
-
39
-
40
-
41
-
42
-
43
-
44
-
45
-
46
-
47
-
48
-
49
-
50
-
51
-
52
-
53
-
54
-
55
-
56
-
57
-
58
-
 59
59 -
 60
60 -
 61
61 -
 62
62 -
 63
63 -
 64
64 -
 65
65 -
 66
66 -
 67
67 -
 68
68 -
 69
69 -
 70
70 -
 71
71 -
 72
72 -
 73
73 -
 74
74 -
 75
75 -
 76
76 -
 77
77 -
 78
78 -
 79
79 -
80
-
81
-
82
-
83
-
84
-
85
-
86
-
87
-
88
-
89
-
90
-
91
-
92
-
93
-
94
-
95
-
96
-
97
-
98
-
99
-
100
-
101
-
102
-
103
-
104
-
105
-
106
-
107
-
108
-
109
-
110
-
111
-
112
-
113
-
114
-
115
-
116
-
117
-
118
-
119
-
120
-
121
-
122
-
123
-
124
-
125
-
126
-
127
-
128
-
129
-
130
-
131
-
132
-
133
-
134
-
135
-
136
-
137
 |
 |
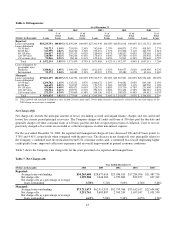
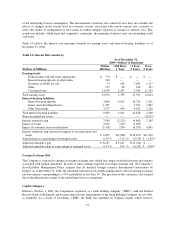
The 30-plus day delinquency rate for the U.S. Card segment was 3.97% at December 31, 2004, down 63 basis
points from December 31, 2003. The decrease in delinquencies is due to the Company’s continued bias toward
originating higher credit quality loans, improved collections experience, and an overall improvement in general
economic conditions.
Auto Finance Segment
The Auto Finance segment primarily consists of automobile financing activities. Total Auto Finance segment
loans increased 18% to $10.0 billion at December 31, 2004, compared to $8.5 billion at December 31, 2003. The
increase in auto loans was primarily the result of growth in prime loans originated through the internet and
growth in loans originated in the dealer segment. For the year ended December 31, 2004, the net income
contribution from the Auto Finance segment increased $64.5 million, or 65% compared to 2003, as a result of
growth in the loan portfolio and improving credit loss experience.
The Company sold $901.3 million and $1.9 billion of auto loans in 2004 and 2003, respectively. These
transactions resulted in pre-tax gains of $40.3 million and $66.4 million for the years ended December 31, 2004
and 2003, respectively. Pre-tax gains allocated to the Auto Finance segment, inclusive of allocations related to
funds transfer pricing, were $41.7 million and $57.3 million in 2004 and 2003, respectively. During 2004, the
Company terminated its forward flow auto receivables agreement; however, the Company plans to continue to
sell auto receivables through other channels.
For the year ended December 31, 2004, the Auto Finance segment’s net charge-off rate was 3.28%, down 134
basis points from the prior year. Net charge-offs of Auto Finance segment loans decreased $54.8 million, or 15%,
while average Auto Finance loans for the year ended December 31, 2004 grew $1.5 billion, or 19%, compared to
the prior year. The decrease in the charge-off rate was primarily driven by improved loan quality, collections
performance and favorable industry trends, partially offset by a $20.4 million one-time acceleration of charge-
offs related to a change in the charge-off recognition process for auto loans in bankruptcy.
The 30-plus day delinquency rate for the Auto Finance segment was 5.50 % at December 31, 2004, down 205
basis points from 7.55% at December 31, 2003. The decrease in delinquencies was the result of a higher mix of
prime loans and improved delinquency performance of non-prime loans.
Global Financial Services Segment
The Global Financial Services segment includes international lending activities (including credit card lending),
installment lending, small business lending and healthcare financing. Total Global Financial Services segment
loans increased 29% to $21.2 billion at December 31, 2004, compared to $16.5 billion at December 31, 2003.
The increase in total loans reflects the Company’s continued successful efforts to diversify its loan portfolio, an
increase in account growth and the impact of changes in foreign currency exchange rates. Net income
contribution from the Global Financial Services segment for the year ended December 31, 2004, increased
$148.2 million, to $213.1 million, compared to the prior year. Global Financial Services segment net income
includes after-tax charges of $17.0 million related to severance and facility consolidation resulting from cost
reduction initiatives, $2.4 million related to changes in asset capitalization thresholds, and $10.3 million from the
impairment of internally developed software. The overall improvement in the Global Financial Services
segment’s financial performance was primarily due to the success of many of the Company’s larger
diversification businesses in the U.S. and U.K.
During 2004, the Company sold its interest in a South African joint venture with a book value of $3.9 million to
its joint venture partner. The Company received $26.2 million in cash, was forgiven $9.2 million in liabilities and
recognized a pre-tax gain of $31.5 million. Also during 2004, the Company sold its French loan portfolio with a
book value of $144.8 million to an external party. The Company received $178.7 million in cash, recorded
$7.2 million in notes receivable and recognized a pre-tax gain of $41.1 million. The respective gains were
recorded in non-interest income and reported in the Global Financial Services segment.
46