Capital One 2004 Annual Report Download - page 90
Download and view the complete annual report
Please find page 90 of the 2004 Capital One annual report below. You can navigate through the pages in the report by either clicking on the pages listed below, or by using the keyword search tool below to find specific information within the annual report.-
 1
1 -
2
-
3
-
4
-
5
-
6
-
7
-
8
-
9
-
10
-
11
-
12
-
13
-
14
-
15
-
16
-
17
-
18
-
19
-
20
-
21
-
22
-
23
-
24
-
25
-
26
-
27
-
28
-
29
-
30
-
31
-
32
-
33
-
34
-
35
-
36
-
37
-
38
-
39
-
40
-
41
-
42
-
43
-
44
-
45
-
46
-
47
-
48
-
49
-
50
-
51
-
52
-
53
-
54
-
55
-
56
-
57
-
58
-
59
-
60
-
61
-
62
-
63
-
64
-
65
-
66
-
67
-
68
-
69
-
70
-
71
-
72
-
73
-
74
-
75
-
76
-
77
-
78
-
79
-
 80
80 -
 81
81 -
 82
82 -
 83
83 -
 84
84 -
 85
85 -
 86
86 -
 87
87 -
 88
88 -
 89
89 -
 90
90 -
 91
91 -
 92
92 -
 93
93 -
 94
94 -
 95
95 -
 96
96 -
 97
97 -
 98
98 -
 99
99 -
 100
100 -
101
-
102
-
103
-
104
-
105
-
106
-
107
-
108
-
109
-
110
-
111
-
112
-
113
-
114
-
115
-
116
-
117
-
118
-
119
-
120
-
121
-
122
-
123
-
124
-
125
-
126
-
127
-
128
-
129
-
130
-
131
-
132
-
133
-
134
-
135
-
136
-
137
 |
 |

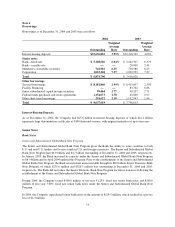
hedging transactions have been highly effective in offsetting changes in the hedged items to which they are
designated and whether those derivatives may be expected to remain highly effective in future periods. Hedge
effectiveness is assessed and measured under identical time periods. To the extent that hedges qualify under
paragraph 68 of SFAS 133, the Company uses the short-cut method to assess effectiveness. Otherwise, the
Company utilizes the dollar-offset method or matches the significant terms of the derivative and hedge item to
determine that the hedging transactions are/or have been highly effective. Changes in fair value of the hedged
item and the hedge instrument are maintained over the life of the hedge and are recorded as of the last day of the
month or quarter. The Company will discontinue hedge accounting prospectively when it is determined that a
derivative has ceased to be highly effective as a hedge.
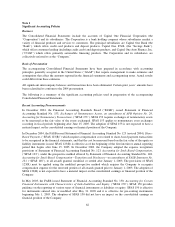
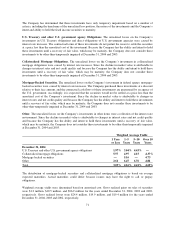
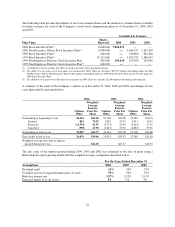
Stock-Based Compensation
Prior to 2003, the Company applied Accounting Principles Board Opinion No. 25, Accounting for Stock Issued to
Employees (“APB 25”) and related Interpretations in accounting for its stock-based compensation plans. No
compensation cost has been recognized for the Company’s fixed stock options for years prior to 2003, as the
exercise price of all such options equals or exceeds the market value of the underlying common stock on the date
of grant. Effective January 1, 2003, the Company adopted the expense recognition provisions of SFAS No. 123,
prospectively to all awards granted, modified, or settled after January 1, 2003. Typically, awards under the
Company’s plans vest over a three year period. Therefore, cost related to stock-based compensation included in
net income for 2004 and 2003 is less than that which would have been recognized if the fair value method had
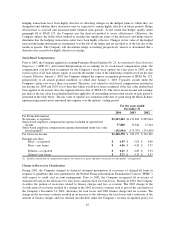
been applied to all awards since the original effective date of SFAS 123. The effect on net income and earnings
per share if the fair value based method had been applied to all outstanding and unvested awards in each period is
presented in the table below. The fair value of options was estimated at the date of grant using the Black-Scholes
option-pricing model and is amortized into expense over the options’ vesting period.
For the years ended
December 31
2004 2003 2002
Pro Forma Information
Net income, as reported $1,543,482 $1,135,842 $ 899,644
Stock-based employee compensation expense included in reported net
income 77,800 31,842 17,204
Stock-based employee compensation expense determined under fair value
based method(1) (192,904) (173,707) (174,439)
Pro forma net income $1,428,378 $ 993,977 $ 742,409
Earnings per share:
Basic—as reported $6.55$ 5.05 $ 4.09
Basic—pro forma $6.06$ 4.42 $ 3.37
Diluted—as reported $6.21$ 4.85 $ 3.93
Diluted—pro forma $5.71$ 4.33 $ 3.37
(1) Includes amortization of compensation expense for current year grants and prior year grants over the options’ vesting period.
Change in Recoveries Classification
During 2002, the Company changed its financial statement presentation of recoveries of charged-off loans in
response to guidelines that were published by the Federal Financial Institutions Examination Council (“FFIEC”)
with respect to credit card account management. Prior to 2002, the Company recognized all recoveries of
charged-off loans in the allowance for loan losses and provision for loan losses. Starting in 2002, the Company
classifies the portion of recoveries related to finance charges and fees as revenue. The 2002 change in the
classification of recoveries resulted in a change to the 2002 recoveries estimate used as part of the calculation of
the Company’s December 31, 2002, allowance for loan losses and 2002 finance charge and fee revenue. The
change in the recoveries estimate resulted in an increase to the allowance for loan losses and a reduction of the
amount of finance charges and fees deemed uncollectible under the Company’s revenue recognition policy for
67