Capital One 2004 Annual Report Download - page 123
Download and view the complete annual report
Please find page 123 of the 2004 Capital One annual report below. You can navigate through the pages in the report by either clicking on the pages listed below, or by using the keyword search tool below to find specific information within the annual report.-
 1
1 -
2
-
3
-
4
-
5
-
6
-
7
-
8
-
9
-
10
-
11
-
12
-
13
-
14
-
15
-
16
-
17
-
18
-
19
-
20
-
21
-
22
-
23
-
24
-
25
-
26
-
27
-
28
-
29
-
30
-
31
-
32
-
33
-
34
-
35
-
36
-
37
-
38
-
39
-
40
-
41
-
42
-
43
-
44
-
45
-
46
-
47
-
48
-
49
-
50
-
51
-
52
-
53
-
54
-
55
-
56
-
57
-
58
-
59
-
60
-
61
-
62
-
63
-
64
-
65
-
66
-
67
-
68
-
69
-
70
-
71
-
72
-
73
-
74
-
75
-
76
-
77
-
78
-
79
-
80
-
81
-
82
-
83
-
84
-
85
-
86
-
87
-
88
-
89
-
90
-
91
-
92
-
93
-
94
-
95
-
96
-
97
-
98
-
99
-
100
-
101
-
102
-
103
-
104
-
105
-
106
-
107
-
108
-
109
-
110
-
111
-
112
-
 113
113 -
 114
114 -
 115
115 -
 116
116 -
 117
117 -
 118
118 -
 119
119 -
 120
120 -
 121
121 -
 122
122 -
 123
123 -
 124
124 -
 125
125 -
 126
126 -
 127
127 -
 128
128 -
 129
129 -
 130
130 -
 131
131 -
 132
132 -
 133
133 -
134
-
135
-
136
-
137
 |
 |

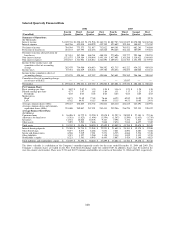
Selected Quarterly Financial Data
2004 2003
(Unaudited)
Fourth
Quarter
Third
Quarter
Second
Quarter
First
Quarter
Fourth
Quarter
Third
Quarter
Second
Quarter
First
Quarter
Summary of Operations:
(In Thousands)
Interest income $1,249,330 $1,228,413 $1,151,946 $1,164,731 $1,087,783 $1,103,025 $1,070,280 $1,106,566
Interest expense 464,766 453,038 440,929 432,709 423,682 399,104 388,017 371,762
Net interest income 784,564 775,375 711,017 732,022 664,101 703,921 682,263 734,804
Provision for loan losses 467,133 267,795 242,256 243,668 390,405 364,144 387,097 375,851
Net interest income after provision for
loan losses 317,431 507,580 468,761 488,354 273,696 339,777 295,166 358,953
Non-interest income 1,521,575 1,539,384 1,396,064 1,443,134 1,437,491 1,363,208 1,310,622 1,304,603
Non-interest expense 1,556,527 1,311,984 1,228,812 1,224,896 1,289,472 1,241,763 1,151,556 1,173,932
Income before income taxes and
cumulative effect of accounting
change 282,479 734,980 636,013 706,592 421,715 461,222 454,232 489,624
Income taxes 87,351 244,819 228,626 255,786 156,034 170,653 168,066 181,161
Income before cumulative effect of
accounting change 195,128 490,161 407,387 450,806 265,681 290,569 286,166 308,463
Cumulative effect of accounting change,
netoftaxesof$8,832 —————15,037——
Net income $ 195,128 $ 490,161 $ 407,387 $ 450,806 $ 265,681 $ 275,532 $ 286,166 $ 308,463
Per Common Share:
Basic earnings per share $ 0.82 $ 2.07 $ 1.74 1.94 $ 1.16 $ 1.23 $ 1.28 1.38
Diluted earnings per share 0.77 1.97 1.65 1.84 1.11 1.17 1.23 1.35
Dividends 0.03 0.03 0.03 0.03 0.03 0.03 0.03 0.03
Market prices
High 84.75 75.49 77.65 76.66 64.25 62.02 54.99 39.70
Low 67.62 64.93 61.15 60.04 55.15 44.51 30.05 24.91
Average common shares (000s) 239,247 236,405 234,732 232,021 228,110 224,615 223,691 222,951
Average common shares and common
equivalent shares (000s) 253,008 249,007 247,591 245,413 239,206 236,270 232,553 228,422
Average Balance Sheet Data:
(In Millions)
Consumer loans $ 36,096 $ 34,772 $ 33,290 $ 32,878 $ 31,297 $ 28,949 $ 27,101 $ 27,316
Allowance for loan losses (1,381) (1,425) (1,494) (1,594) (1,567) (1,590) (1,635) (1,719)
Securities 11,531 10,646 10,578 9,347 7,598 7,331 7,535 5,352
Other assets 7,093 7,503 7,646 7,068 7,674 7,014 6,677 7,369
Total assets $ 53,339 $ 51,496 $ 50,020 $ 47,699 $ 45,002 $ 41,704 $ 39,678 $ 38,318
Interest-bearing deposits $ 25,580 $ 24,714 $ 23,948 $ 22,993 $ 21,605 $ 20,303 $ 19,178 $ 17,940
Other borrowings 9,077 8,675 8,488 7,834 7,661 6,892 6,683 7,010
Senior and deposit notes 6,946 7,219 7,381 7,271 6,735 6,066 5,534 5,310
Other liabilities 3,515 3,327 3,260 3,158 3,114 3,019 3,135 3,235
Stockholder’s equity 8,221 7,561 6,943 6,443 5,887 5,424 5,148 4,823
Total liabilities and stockholders’ equity $ 53,339 $ 51,496 $ 50,020 $ 47,699 $ 45,002 $ 41,704 $ 39,678 $ 38,318
The above schedule is a tabulation of the Company’s unaudited quarterly results for the years ended December 31, 2004 and 2003. The
Company’s common shares are traded on the New York Stock Exchange under the symbol COF. In addition, shares may be traded in the
over-the-counter stock market. There were 9,721 and 10,227 common stockholders of record as of December 31, 2004 and 2003, respectively.
100