Capital One 2004 Annual Report Download - page 115
Download and view the complete annual report
Please find page 115 of the 2004 Capital One annual report below. You can navigate through the pages in the report by either clicking on the pages listed below, or by using the keyword search tool below to find specific information within the annual report.-
 1
1 -
2
-
3
-
4
-
5
-
6
-
7
-
8
-
9
-
10
-
11
-
12
-
13
-
14
-
15
-
16
-
17
-
18
-
19
-
20
-
21
-
22
-
23
-
24
-
25
-
26
-
27
-
28
-
29
-
30
-
31
-
32
-
33
-
34
-
35
-
36
-
37
-
38
-
39
-
40
-
41
-
42
-
43
-
44
-
45
-
46
-
47
-
48
-
49
-
50
-
51
-
52
-
53
-
54
-
55
-
56
-
57
-
58
-
59
-
60
-
61
-
62
-
63
-
64
-
65
-
66
-
67
-
68
-
69
-
70
-
71
-
72
-
73
-
74
-
75
-
76
-
77
-
78
-
79
-
80
-
81
-
82
-
83
-
84
-
85
-
86
-
87
-
88
-
89
-
90
-
91
-
92
-
93
-
94
-
95
-
96
-
97
-
98
-
99
-
100
-
101
-
102
-
103
-
104
-
 105
105 -
 106
106 -
 107
107 -
 108
108 -
 109
109 -
 110
110 -
 111
111 -
 112
112 -
 113
113 -
 114
114 -
 115
115 -
 116
116 -
 117
117 -
 118
118 -
 119
119 -
 120
120 -
 121
121 -
 122
122 -
 123
123 -
 124
124 -
 125
125 -
126
-
127
-
128
-
129
-
130
-
131
-
132
-
133
-
134
-
135
-
136
-
137
 |
 |

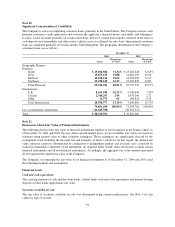
Note 20
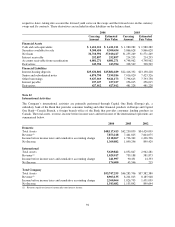
Significant Concentration of Credit Risk
The Company is active in originating consumer loans, primarily in the United States. The Company reviews each
potential customer’s credit application and evaluates the applicant’s financial history and ability and willingness
to repay. Loans are made primarily on an unsecured basis; however, certain loans require collateral in the form of
cash deposits and automobiles and other motor vehicles serve as collateral for auto loans. International consumer
loans are originated primarily in Canada and the United Kingdom. The geographic distribution of the Company’s
consumer loans was as follows:
December 31
2004 2003
Loans
Percentage
of Total Loans
Percentage
of Total
Geographic Region:
Domestic
South $ 25,034,582 31.34% $ 23,262,643 32.65%
West 15,873,159 19.88 14,662,193 20.58
Midwest 15,220,162 19.06 13,643,202 19.15
Northeast 13,198,619 16.53 12,029,894 16.89
Total Domestic 69,326,522 86.81% 63,597,932 89.27%
International
U.K. 8,163,109 10.22% 5,546,644 7.78%
Canada 2,360,297 2.96 1,935,396 2.72
Other 11,371 .01 164,824 0.23
Total International 10,534,777 13.19% 7,646,864 10.73%
79,861,299 100.00% 71,244,796 100.00%
Less securitization adjustments (41,645,708) (38,394,527)
Total $ 38,215,591 $ 32,850,269
Note 21
Disclosures About Fair Value of Financial Instruments
The following discloses the fair value of financial instruments whether or not recognized in the balance sheets as
of December 31, 2004 and 2003. In cases where quoted market prices are not available, fair values are based on
estimates using present value or other valuation techniques. Those techniques are significantly affected by the
assumptions used, including the discount rate and estimates of future cash flows. In that regard, the derived fair
value estimates cannot be substantiated by comparison to independent markets and, in many cases, could not be
realized in immediate settlement of the instrument. As required under GAAP, these disclosures exclude certain
financial instruments and all non-financial instruments. Accordingly, the aggregate fair value amounts presented
do not represent the underlying value of the Company.
The Company, in estimating the fair value of its financial instruments as of December 31, 2004 and 2003, used
the following methods and assumptions:
Financial Assets
Cash and cash equivalents
The carrying amounts of cash and due from banks, federal funds sold and resale agreements and interest-bearing
deposits at other banks approximate fair value.
Securities available for sale
The fair value of securities available for sale was determined using current market prices. See Note 3 for fair
values by type of security.
92