Capital One 2004 Annual Report Download - page 72
Download and view the complete annual report
Please find page 72 of the 2004 Capital One annual report below. You can navigate through the pages in the report by either clicking on the pages listed below, or by using the keyword search tool below to find specific information within the annual report.-
 1
1 -
2
-
3
-
4
-
5
-
6
-
7
-
8
-
9
-
10
-
11
-
12
-
13
-
14
-
15
-
16
-
17
-
18
-
19
-
20
-
21
-
22
-
23
-
24
-
25
-
26
-
27
-
28
-
29
-
30
-
31
-
32
-
33
-
34
-
35
-
36
-
37
-
38
-
39
-
40
-
41
-
42
-
43
-
44
-
45
-
46
-
47
-
48
-
49
-
50
-
51
-
52
-
53
-
54
-
55
-
56
-
57
-
58
-
59
-
60
-
61
-
 62
62 -
 63
63 -
 64
64 -
 65
65 -
 66
66 -
 67
67 -
 68
68 -
 69
69 -
 70
70 -
 71
71 -
 72
72 -
 73
73 -
 74
74 -
 75
75 -
 76
76 -
 77
77 -
 78
78 -
 79
79 -
 80
80 -
 81
81 -
 82
82 -
83
-
84
-
85
-
86
-
87
-
88
-
89
-
90
-
91
-
92
-
93
-
94
-
95
-
96
-
97
-
98
-
99
-
100
-
101
-
102
-
103
-
104
-
105
-
106
-
107
-
108
-
109
-
110
-
111
-
112
-
113
-
114
-
115
-
116
-
117
-
118
-
119
-
120
-
121
-
122
-
123
-
124
-
125
-
126
-
127
-
128
-
129
-
130
-
131
-
132
-
133
-
134
-
135
-
136
-
137
 |
 |

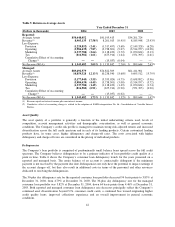
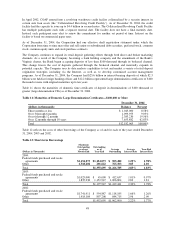
Additional information regarding funding can be found on pages 73-75 in Item 8 “Financial Statements and
Supplementary Data—Notes to the Consolidated Financial Statements—Note 6”.
Funding Obligations
Table 13 summarizes the amounts and maturities of the contractual funding obligations of the Company,
including off-balance sheet funding.
Table 13: Funding Obligations
As of December 31, 2004
Total Up to 1 year 1-3 years 4-5 years
After 5
years
Interest-bearing deposits $25,636,802 $ 7,682,475 $ 9,132,041 $ 7,591,092 $1,231,194
Senior and subordinated notes 6,874,790 1,456,523 1,525,175 1,996,209 1,896,883
Other borrowings(1) 9,637,019 4,837,008 3,946,622 853,389 —
Operating leases 214,723 41,275 70,182 68,753 34,513
Off-balance sheet securitization
amortization 41,102,148 8,379,324 15,003,728 11,708,133 6,010,963
Total obligations $83,465,482 $22,396,605 $29,677,748 $22,217,576 $9,173,553
(1) Other borrowings includes secured borrowings for the Company’s on-balance sheet auto loan securitizations, junior subordinated capital
income securities, federal funds purchased and resale agreements and other short-term borrowings.
The terms of the lease and credit facility agreements related to certain other borrowings and operating leases in
Table 13 require several financial covenants (including performance measures and equity ratios) to be met. If
these covenants are not met, there may be an acceleration of the payment due dates noted above. As of December
31, 2004, the Company was not in default of any such covenants.
Liquidity Risk Management
Liquidity risk management refers to the way the Company manages the use and availability of various funding
sources to meet its current and future operating needs. These needs change as loans grow, securitizations, debt
and other deposits mature, and payments on other obligations are met. Because the characteristics of the
Company’s assets and liabilities change, liquidity risk management is a dynamic process, affected by the pricing
and maturity of investment securities, loans, deposits, securitizations and other assets and liabilities.
To facilitate liquidity risk management, the Company uses a variety of funding sources to establish a maturity
pattern that provides a prudent mixture of short-term and long-term funds. The Company obtains funds through
the gathering of deposits, issuing debt and equity, and securitizing assets. Further liquidity is provided to the
Company through committed facilities. As of December 31, 2004, the Corporation, the Bank, the Savings Bank
and COAF collectively had over $10.5 billion in unused commitments under various credit facilities (including
the Collateralized Revolving Credit Facility) and unused conduit capacity available for liquidity needs.
Additionally, the Company maintains a portfolio of highly rated and highly liquid securities in order to provide
adequate liquidity and to meet its ongoing cash needs. As of December 31, 2004, the Company had $10.7 billion
of such securities, cash and cash equivalents.
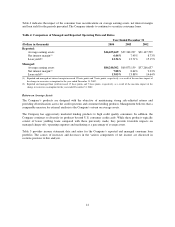
As discussed in “Off-Balance Sheet Arrangements,” a significant source of liquidity for the Company has been
the securitization of consumer loans. As of December 31, 2004 the Company funded approximately 52% of its
managed loans through off-balance sheet securitizations. The Company expects to securitize additional loan
principal receivables during 2005. The Company’s securitization program has maturities in 2005 and through
2019. The revolving securitizations have accumulation periods during which principal payments are aggregated
to make payments to investors. As payments on the loans are accumulated and are no longer reinvested in new
loans, the Company’s funding requirements for such new loans increase accordingly. The occurrence of certain
49