Capital One 2004 Annual Report Download - page 60
Download and view the complete annual report
Please find page 60 of the 2004 Capital One annual report below. You can navigate through the pages in the report by either clicking on the pages listed below, or by using the keyword search tool below to find specific information within the annual report.-
 1
1 -
2
-
3
-
4
-
5
-
6
-
7
-
8
-
9
-
10
-
11
-
12
-
13
-
14
-
15
-
16
-
17
-
18
-
19
-
20
-
21
-
22
-
23
-
24
-
25
-
26
-
27
-
28
-
29
-
30
-
31
-
32
-
33
-
34
-
35
-
36
-
37
-
38
-
39
-
40
-
41
-
42
-
43
-
44
-
45
-
46
-
47
-
48
-
49
-
 50
50 -
 51
51 -
 52
52 -
 53
53 -
 54
54 -
 55
55 -
 56
56 -
 57
57 -
 58
58 -
 59
59 -
 60
60 -
 61
61 -
 62
62 -
 63
63 -
 64
64 -
 65
65 -
 66
66 -
 67
67 -
 68
68 -
 69
69 -
 70
70 -
71
-
72
-
73
-
74
-
75
-
76
-
77
-
78
-
79
-
80
-
81
-
82
-
83
-
84
-
85
-
86
-
87
-
88
-
89
-
90
-
91
-
92
-
93
-
94
-
95
-
96
-
97
-
98
-
99
-
100
-
101
-
102
-
103
-
104
-
105
-
106
-
107
-
108
-
109
-
110
-
111
-
112
-
113
-
114
-
115
-
116
-
117
-
118
-
119
-
120
-
121
-
122
-
123
-
124
-
125
-
126
-
127
-
128
-
129
-
130
-
131
-
132
-
133
-
134
-
135
-
136
-
137
 |
 |

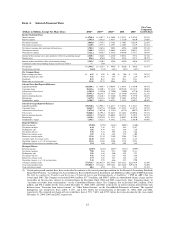
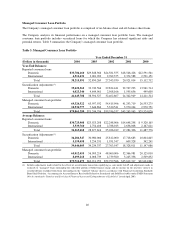
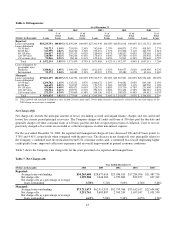
Interest Variance Analysis
Net interest income is affected by changes in the average interest rate generated on earning assets and the average
interest rate paid on interest-bearing liabilities. In addition, net interest income is affected by changes in the
volume of earning assets and interest-bearing liabilities. Table 2 sets forth the dollar amount of the increases and
decreases in interest income and interest expense resulting from changes in the volume of earning assets and
interest-bearing liabilities and from changes in yields and rates.
Table 2: Interest Variance Analysis
Year Ended December 31
2004 vs. 2003 2003 vs. 2002
Change due to(1) Change due to(1)
(Dollars in thousands)
Increase
(Decrease) Volume
Yield/
Rate
Increase
(Decrease)(2) Volume
Yield/
Rate
Interest Income:
Consumer loans
Domestic $265,042 $621,769 $(356,727) $142,602 $527,384 $(348,003)
International 37,083 91,268 (54,185) (2,768) (4,294) 3,123
Total consumer loans 302,125 716,011 (413,886) 139,834 516,636 (338,426)
Securities available for sale 119,780 124,802 (5,022) 8,187 59,359 (51,172)
Other
Domestic (23,056) (19,446) (3,610) 28,727 72,817 (44,090)
International 27,917 24,302 3,615 10,140 11,984 (1,844)
Total Other 4,861 11,471 (6,610) 38,867 86,542 (47,675)
Total interest income 426,766 997,989 (571,223) 186,888 764,253 (538,989)
Interest Expense:
Deposits
Domestic 98,828 164,969 (66,141) 68,706 181,224 (112,518)
International 19,067 31,243 (12,176) 11,055 16,202 (5,147)
Total Deposits 117,895 192,915 (75,020) 79,761 197,260 (117,499)
Senior and subordinated notes 62,986 88,136 (25,150) 15,621 17,704 (2,083)
Other borrowings
Domestic 27,963 51,829 (23,866) 26,536 53,744 (27,208)
International 33 (3) 36 (1,007) (590) (417)
Total Other borrowings 27,996 51,821 (23,825) 25,529 52,916 (27,387)
Total interest expense 208,877 332,758 (123,881) 120,911 289,535 (168,624)
Net interest income $217,889 $631,687 $(413,798) $ 65,977 $492,017 $(387,664)
(1) The change in interest due to both volume and rates has been allocated in proportion to the relationship of the absolute dollar amounts of
the change in each. The changes in income and expense are calculated independently for each line in the table. The totals for the volume
and yield/rate columns are not the sum of the individual lines.
(2) The change in interest income includes $38.4 million related to the one-time impact of the change in recoveries assumption for the year
ended December 31, 2002.
37