Capital One 2004 Annual Report Download - page 95
Download and view the complete annual report
Please find page 95 of the 2004 Capital One annual report below. You can navigate through the pages in the report by either clicking on the pages listed below, or by using the keyword search tool below to find specific information within the annual report.-
 1
1 -
2
-
3
-
4
-
5
-
6
-
7
-
8
-
9
-
10
-
11
-
12
-
13
-
14
-
15
-
16
-
17
-
18
-
19
-
20
-
21
-
22
-
23
-
24
-
25
-
26
-
27
-
28
-
29
-
30
-
31
-
32
-
33
-
34
-
35
-
36
-
37
-
38
-
39
-
40
-
41
-
42
-
43
-
44
-
45
-
46
-
47
-
48
-
49
-
50
-
51
-
52
-
53
-
54
-
55
-
56
-
57
-
58
-
59
-
60
-
61
-
62
-
63
-
64
-
65
-
66
-
67
-
68
-
69
-
70
-
71
-
72
-
73
-
74
-
75
-
76
-
77
-
78
-
79
-
80
-
81
-
82
-
83
-
84
-
 85
85 -
 86
86 -
 87
87 -
 88
88 -
 89
89 -
 90
90 -
 91
91 -
 92
92 -
 93
93 -
 94
94 -
 95
95 -
 96
96 -
 97
97 -
 98
98 -
 99
99 -
 100
100 -
 101
101 -
 102
102 -
 103
103 -
 104
104 -
 105
105 -
106
-
107
-
108
-
109
-
110
-
111
-
112
-
113
-
114
-
115
-
116
-
117
-
118
-
119
-
120
-
121
-
122
-
123
-
124
-
125
-
126
-
127
-
128
-
129
-
130
-
131
-
132
-
133
-
134
-
135
-
136
-
137
 |
 |
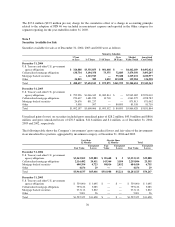
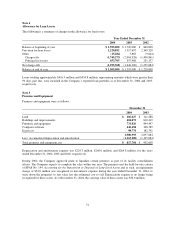
Note 4
Allowance for Loan Losses
The following is a summary of changes in the allowance for loan losses:
Year Ended December 31
2004 2003 2002
Balance at beginning of year $ 1,595,000 $ 1,720,000 $ 840,000
Provision for loan losses 1,220,852 1,517,497 2,149,328
Other (15,284) 3,863 (9,644)
Charge-offs (1,749,273) (2,004,328) (1,490,841)
Principal recoveries 453,705 357,968 231,157
Net charge-offs (1,295,568) (1,646,360) (1,259,684)
Balance at end of year $ 1,505,000 $ 1,595,000 $ 1,720,000
Loans totaling approximately $416.9 million and $454.8 million, representing amounts which were greater than
90 days past due, were included in the Company’s reported loan portfolio as of December 31, 2004 and 2003,
respectively.
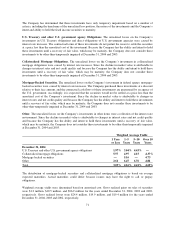
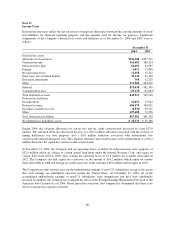
Note 5
Premises and Equipment
Premises and equipment were as follows:
December 31
2004 2003
Land $ 106,627 $ 111,288
Buildings and improvements 604,072 610,419
Furniture and equipment 731,026 844,447
Computer software 440,494 348,789
In process 98,774 182,741
1,980,993 2,097,684
Less: Accumulated depreciation and amortization (1,163,289) (1,195,084)
Total premises and equipment, net $ 817,704 $ 902,600
Depreciation and amortization expense was $224.3 million, $260.6 million, and $264.8 million, for the years
ended December 31, 2004, 2003 and 2002, respectively.
During 2004, the Company approved plans to liquidate certain premises as part of its facility consolidation
efforts. The Company expects to complete the sales within one year. The premises met the held-for-sale criteria
of SFAS No. 144, Accounting for the Impairment or Disposal of Long-Lived Assets and as such, an impairment
charge of $54.0 million was recognized in non-interest expense during the year ended December 31, 2004, to
write down the properties to fair value less the estimated cost to sell. Depreciation expense is no longer being
recognized for these assets. As of December 31, 2004, the carrying value of these assets was $56.9 million.
72