Capital One 2004 Annual Report Download - page 63
Download and view the complete annual report
Please find page 63 of the 2004 Capital One annual report below. You can navigate through the pages in the report by either clicking on the pages listed below, or by using the keyword search tool below to find specific information within the annual report.-
 1
1 -
2
-
3
-
4
-
5
-
6
-
7
-
8
-
9
-
10
-
11
-
12
-
13
-
14
-
15
-
16
-
17
-
18
-
19
-
20
-
21
-
22
-
23
-
24
-
25
-
26
-
27
-
28
-
29
-
30
-
31
-
32
-
33
-
34
-
35
-
36
-
37
-
38
-
39
-
40
-
41
-
42
-
43
-
44
-
45
-
46
-
47
-
48
-
49
-
50
-
51
-
52
-
 53
53 -
 54
54 -
 55
55 -
 56
56 -
 57
57 -
 58
58 -
 59
59 -
 60
60 -
 61
61 -
 62
62 -
 63
63 -
 64
64 -
 65
65 -
 66
66 -
 67
67 -
 68
68 -
 69
69 -
 70
70 -
 71
71 -
 72
72 -
 73
73 -
74
-
75
-
76
-
77
-
78
-
79
-
80
-
81
-
82
-
83
-
84
-
85
-
86
-
87
-
88
-
89
-
90
-
91
-
92
-
93
-
94
-
95
-
96
-
97
-
98
-
99
-
100
-
101
-
102
-
103
-
104
-
105
-
106
-
107
-
108
-
109
-
110
-
111
-
112
-
113
-
114
-
115
-
116
-
117
-
118
-
119
-
120
-
121
-
122
-
123
-
124
-
125
-
126
-
127
-
128
-
129
-
130
-
131
-
132
-
133
-
134
-
135
-
136
-
137
 |
 |

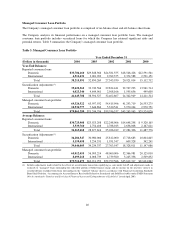
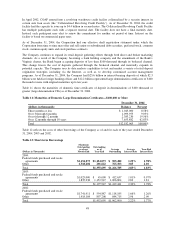
Managed Consumer Loan Portfolio
The Company’s managed consumer loan portfolio is comprised of on-balance sheet and off-balance sheet loans.
The Company analyzes its financial performance on a managed consumer loan portfolio basis. The managed
consumer loan portfolio includes securitized loans for which the Company has retained significant risks and
potential returns. Table 3 summarizes the Company’s managed consumer loan portfolio.
Table 3: Managed Consumer Loan Portfolio
Year Ended December 31
(Dollars in thousands) 2004 2003 2002 2001 2000
Year-End Balances:
Reported consumer loans:
Domestic $33,704,160 $29,848,366 $24,581,555 $18,546,426 $12,591,561
International 4,511,431 3,001,903 2,762,375 2,374,588 2,521,151
Total 38,215,591 32,850,269 27,343,930 20,921,014 15,112,712
Securitization Adjustments(1):
Domestic 35,622,362 33,749,566 29,834,441 22,747,293 13,961,714
International 6,023,346 4,644,961 2,568,166 1,595,656 449,600
Total 41,645,708 38,394,527 32,402,607 24,342,949 14,411,314
Managed consumer loan portfolio:
Domestic 69,326,522 63,597,932 54,415,996 41,293,719 26,553,275
International 10,534,777 7,646,864 5,330,541 3,970,244 2,970,751
Total $79,861,299 $71,244,796 $59,746,537 $45,263,963 $29,524,026
Average Balances:
Reported consumer loans:
Domestic $30,725,908 $25,923,208 $22,248,006 $14,648,298 $ 9,320,165
International 3,539,760 2,754,408 2,788,013 2,636,008 2,167,611
Total 34,265,668 28,677,616 25,036,019 17,284,306 11,487,776
Securitization Adjustments(1):
Domestic 34,286,547 30,980,006 25,812,000 17,718,683 10,804,845
International 5,159,458 3,254,331 1,951,547 609,328 342,241
Total 39,446,005 34,234,337 27,763,547 18,328,011 11,147,086
Managed consumer loan portfolio:
Domestic 65,012,455 56,903,214 48,060,006 32,366,981 20,125,010
International 8,699,218 6,008,739 4,739,560 3,245,336 2,509,852
Total $73,711,673 $62,911,953 $52,799,566 $35,612,317 $22,634,862
(1) Includes adjustments made related to the effects of securitization transactions qualifying as sales under GAAP and adjustments made to
reclassify to “managed” loans outstanding the collectible portion of billed finance charge and fee income on the investors’ interest in
securitized loans excluded from loans outstanding on the “reported” balance sheet in accordance with Financial Accounting Standards
Board Staff Position, “Accounting for Accrued Interest Receivable Related to Securitized and Sold Receivables under FASB Statement
140, Accounting for Transfers and Servicing of Financial Assets and Extinguishments of Liabilities” issued April 2003.
40