Capital One 2004 Annual Report Download - page 66
Download and view the complete annual report
Please find page 66 of the 2004 Capital One annual report below. You can navigate through the pages in the report by either clicking on the pages listed below, or by using the keyword search tool below to find specific information within the annual report.-
 1
1 -
2
-
3
-
4
-
5
-
6
-
7
-
8
-
9
-
10
-
11
-
12
-
13
-
14
-
15
-
16
-
17
-
18
-
19
-
20
-
21
-
22
-
23
-
24
-
25
-
26
-
27
-
28
-
29
-
30
-
31
-
32
-
33
-
34
-
35
-
36
-
37
-
38
-
39
-
40
-
41
-
42
-
43
-
44
-
45
-
46
-
47
-
48
-
49
-
50
-
51
-
52
-
53
-
54
-
55
-
 56
56 -
 57
57 -
 58
58 -
 59
59 -
 60
60 -
 61
61 -
 62
62 -
 63
63 -
 64
64 -
 65
65 -
 66
66 -
 67
67 -
 68
68 -
 69
69 -
 70
70 -
 71
71 -
 72
72 -
 73
73 -
 74
74 -
 75
75 -
 76
76 -
77
-
78
-
79
-
80
-
81
-
82
-
83
-
84
-
85
-
86
-
87
-
88
-
89
-
90
-
91
-
92
-
93
-
94
-
95
-
96
-
97
-
98
-
99
-
100
-
101
-
102
-
103
-
104
-
105
-
106
-
107
-
108
-
109
-
110
-
111
-
112
-
113
-
114
-
115
-
116
-
117
-
118
-
119
-
120
-
121
-
122
-
123
-
124
-
125
-
126
-
127
-
128
-
129
-
130
-
131
-
132
-
133
-
134
-
135
-
136
-
137
 |
 |

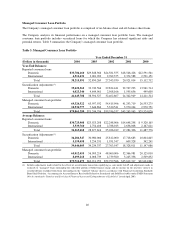
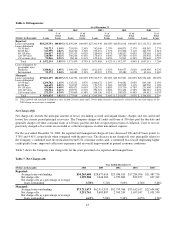
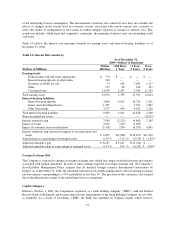
Table 6: Delinquencies
As of December 31
2004 2003 2002(1) 2001 2000
(Dollars in thousands) Loans
%of
Total
Loans Loans
%of
Total
Loans Loans
%of
Total
Loans Loans
%of
Total
Loans Loans
%of
Total
Loans
Reported:
Loans outstanding $38,215,591 100.00% $32,850,269 100.00% $27,343,930 100.00% $20,921,014 100.00% $15,112,712 100.00%
Loans delinquent:
30-59 days 741,723 1.94% 755,930 2.30% 762,040 2.79% 494,871 2.37% 418,967 2.77%
60-89 days 313,559 0.82% 362,766 1.10% 373,451 1.37% 233,206 1.11% 242,770 1.61%
90-119 days 196,457 0.51% 207,353 0.63% 238,091 0.87% 144,957 0.69% 178,001 1.18%
120-149 days 120,589 0.32% 149,246 0.45% 174,651 0.64% 85,580 0.41% 136,932 0.91%
150 or more days 99,866 0.26% 98,164 0.31% 125,636 0.45% 53,943 0.26% 120,641 0.79%
Total $ 1,472,194 3.85%$ 1,573,459 4.79% $ 1,673,869 6.12% $ 1,012,557 4.84% $ 1,097,311 7.26%
Loans delinquent by
geographic area:
Domestic 1,380,022 4.05% 1,509,370 5.06% 1,611,650 6.56% 930,077 5.02% 1,034,995 8.23%
International 92,172 2.04% 64,089 2.13% 62,219 2.25% 82,480 3.47% 62,316 2.46%
Managed:
Loans outstanding $79,861,299 100.00% $71,244,796 100.00% $59,746,537 100.00% $45,263,963 100.00% $29,524,026 100.00%
Loans delinquent:
30-59 days 1,299,782 1.63% 1,335,231 1.87% 1,366,072 2.29% 934,681 2.06% 605,040 2.05%
60-89 days 664,629 0.83% 718,247 1.01% 753,735 1.26% 502,959 1.11% 349,250 1.18%
90-119 days 479,404 0.60% 488,471 0.69% 526,710 0.88% 353,750 0.78% 251,690 0.85%
120-149 days 336,924 0.42% 365,971 0.51% 394,721 0.66% 251,434 0.56% 184,061 0.62%
150 or more days 273,339 0.34% 270,009 0.38% 304,156 0.51% 198,823 0.44% 154,613 0.53%
Total $ 3,054,078 3.82%$ 3,177,929 4.46% $ 3,345,394 5.60% $ 2,241,647 4.95% $ 1,544,654 5.23%
(1) 2002 reported and managed delinquency rates include 28 basis point and 13 basis point increases, respectively, related to the one-time impact of the
2002 change in recoveries assumption.
Net Charge-Offs
Net charge-offs include the principal amount of losses (excluding accrued and unpaid finance charges and fees and fraud
losses) less current period principal recoveries. The Company charges off credit card loans at 180 days past the due date and
generally charges off other consumer loans at 120 days past the due date or upon repossession of collateral. Costs to recover
previously charged-off accounts are recorded as collection expenses in other non-interest expense.
For the year ended December 31, 2004, the reported and managed net charge-off rates decreased 196 and 145 basis points, to
3.78% and 4.41%, respectively when compared with the prior year. The decrease in net charge-off rates principally relates to
the Company’s continued asset diversification beyond U.S. consumer credit cards, a continued bias toward originating higher
credit quality loans, improved collections experience and an overall improvement in general economic conditions.
Table 7 shows the Company’s net charge-offs for the years presented on a reported and managed basis.
Table 7: Net Charge-offs
Year Ended December 31
(Dollars in thousands) 2004 2003 2002 2001 2000
Reported:
Average loans outstanding $34,265,668 $28,677,616 $25,036,019 $17,284,306 $11,487,776
Net charge-offs 1,295,568 1,646,360 1,259,684 822,257 627,312
Net charge-offs as a percentage of average
loans outstanding 3.78% 5.74% 5.03% 4.76% 5.46%
Managed:
Average loans outstanding $73,711,673 $62,911,953 $52,799,566 $35,612,617 $22,634,862
Net charge-offs 3,251,761 3,683,887 2,769,249 1,655,947 1,031,590
Net charge-offs as a percentage of average
loans outstanding 4.41% 5.86% 5.24% 4.65% 4.56%
43