Capital One 2004 Annual Report Download - page 82
Download and view the complete annual report
Please find page 82 of the 2004 Capital One annual report below. You can navigate through the pages in the report by either clicking on the pages listed below, or by using the keyword search tool below to find specific information within the annual report.-
 1
1 -
2
-
3
-
4
-
5
-
6
-
7
-
8
-
9
-
10
-
11
-
12
-
13
-
14
-
15
-
16
-
17
-
18
-
19
-
20
-
21
-
22
-
23
-
24
-
25
-
26
-
27
-
28
-
29
-
30
-
31
-
32
-
33
-
34
-
35
-
36
-
37
-
38
-
39
-
40
-
41
-
42
-
43
-
44
-
45
-
46
-
47
-
48
-
49
-
50
-
51
-
52
-
53
-
54
-
55
-
56
-
57
-
58
-
59
-
60
-
61
-
62
-
63
-
64
-
65
-
66
-
67
-
68
-
69
-
70
-
71
-
 72
72 -
 73
73 -
 74
74 -
 75
75 -
 76
76 -
 77
77 -
 78
78 -
 79
79 -
 80
80 -
 81
81 -
 82
82 -
 83
83 -
 84
84 -
 85
85 -
 86
86 -
 87
87 -
 88
88 -
 89
89 -
 90
90 -
 91
91 -
 92
92 -
93
-
94
-
95
-
96
-
97
-
98
-
99
-
100
-
101
-
102
-
103
-
104
-
105
-
106
-
107
-
108
-
109
-
110
-
111
-
112
-
113
-
114
-
115
-
116
-
117
-
118
-
119
-
120
-
121
-
122
-
123
-
124
-
125
-
126
-
127
-
128
-
129
-
130
-
131
-
132
-
133
-
134
-
135
-
136
-
137
 |
 |

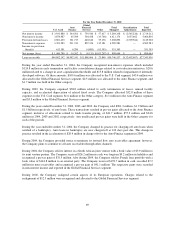
CONSOLIDATED STATEMENTS OF INCOME
Year Ended December 31 (In Thousands, Except Per Share Data) 2004 2003 2002
Interest Income:
Consumer loans, including past-due fees $4,234,420 $3,932,295 $3,792,461
Securities available for sale 312,374 192,594 184,407
Other 247,626 242,765 203,898
Total interest income 4,794,420 4,367,654 4,180,766
Interest Expense:
Deposits 1,009,545 891,650 811,889
Senior and subordinated notes 486,812 423,826 408,205
Other borrowings 295,085 267,089 241,560
Total interest expense 1,791,442 1,582,565 1,461,654
Net interest income 3,002,978 2,785,089 2,719,112
Provision for loan losses 1,220,852 1,517,497 2,149,328
Net interest income after provision for loan losses 1,782,126 1,267,592 569,784
Non-Interest Income:
Servicing and securitizations 3,643,808 3,211,662 2,805,501
Service charges and other customer-related fees 1,482,658 1,630,185 1,937,735
Interchange 475,810 376,785 447,747
Other 297,881 197,292 275,853
Total non-interest income 5,900,157 5,415,924 5,466,836
Non-Interest Expense:
Salaries and associate benefits 1,642,721 1,570,415 1,557,887
Marketing 1,337,780 1,118,422 1,070,624
Communications and data processing 475,355 448,110 406,071
Supplies and equipment 349,920 344,049 357,953
Occupancy 206,614 185,179 205,531
Other 1,309,829 1,190,548 987,515
Total non-interest expense 5,322,219 4,856,723 4,585,581
Income before income taxes and cumulative effect of accounting change 2,360,064 1,826,793 1,451,039
Income taxes 816,582 675,914 551,395
Income before cumulative effect of accounting change 1,543,482 1,150,879 899,644
Cumulative effect of accounting change, net of taxes of $8,832 — 15,037 —
Net income $1,543,482 $1,135,842 $ 899,644
Basic earnings per share before cumulative effect of accounting change $6.55$ 5.12 $ 4.09
Basic earnings per share after cumulative effect of accounting change $6.55$ 5.05 $ 4.09
Diluted earnings per share before cumulative effect of accounting change $6.21$ 4.92 $ 3.93
Diluted earnings per share after cumulative effect of accounting change $6.21$ 4.85 $ 3.93
Dividends paid per share $0.11$ 0.11 $ 0.11
See Notes to Consolidated Financial Statements.
59