Capital One 2004 Annual Report Download - page 58
Download and view the complete annual report
Please find page 58 of the 2004 Capital One annual report below. You can navigate through the pages in the report by either clicking on the pages listed below, or by using the keyword search tool below to find specific information within the annual report.-
 1
1 -
2
-
3
-
4
-
5
-
6
-
7
-
8
-
9
-
10
-
11
-
12
-
13
-
14
-
15
-
16
-
17
-
18
-
19
-
20
-
21
-
22
-
23
-
24
-
25
-
26
-
27
-
28
-
29
-
30
-
31
-
32
-
33
-
34
-
35
-
36
-
37
-
38
-
39
-
40
-
41
-
42
-
43
-
44
-
45
-
46
-
47
-
 48
48 -
 49
49 -
 50
50 -
 51
51 -
 52
52 -
 53
53 -
 54
54 -
 55
55 -
 56
56 -
 57
57 -
 58
58 -
 59
59 -
 60
60 -
 61
61 -
 62
62 -
 63
63 -
 64
64 -
 65
65 -
 66
66 -
 67
67 -
 68
68 -
69
-
70
-
71
-
72
-
73
-
74
-
75
-
76
-
77
-
78
-
79
-
80
-
81
-
82
-
83
-
84
-
85
-
86
-
87
-
88
-
89
-
90
-
91
-
92
-
93
-
94
-
95
-
96
-
97
-
98
-
99
-
100
-
101
-
102
-
103
-
104
-
105
-
106
-
107
-
108
-
109
-
110
-
111
-
112
-
113
-
114
-
115
-
116
-
117
-
118
-
119
-
120
-
121
-
122
-
123
-
124
-
125
-
126
-
127
-
128
-
129
-
130
-
131
-
132
-
133
-
134
-
135
-
136
-
137
 |
 |
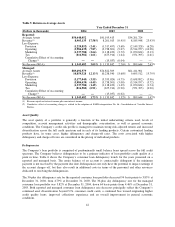
For the year ended December 31, 2003, the provision for loan losses decreased to $1.5 billion from $2.1 billion
for the year ended December 31, 2002. Excluding the impact of the one-time change in recoveries estimate of
$133.4 million for the year ended December 31, 2002, the provision decreased $498.4 million, or 25%. The
decrease in the provision for loan losses reflects improving delinquency rates and lower forecasted charge-offs
for the reported loan portfolio at December 31, 2003. The decrease in delinquency and forecasted charge-off
rates reflects a change in the mix of the reported loan portfolio towards a higher concentration of higher credit
quality loans; as a result the allowance to reported loans decreased to 4.86% at December 31, 2003 from 6.29%
at December 31, 2002.
For the year ended December 31, 2003, pre-tax gains on sales of auto loans increased $38.2 million to $66.4
million from $28.2 million for the year ended December 31, 2002.
During 2003, the Company realized pre-tax losses on the sales of securities totaling $9.4 million, compared to
$77.5 million of after-tax gains on sales of securities recognized in 2002. In addition, there were no gains on the
repurchase of senior bank notes recognized during 2003, compared to pre-tax gains of $27.0 million recognized
in 2002. The Company routinely evaluates its liquidity portfolio positions and rebalances its investment portfolio
when appropriate, which results in periodic gains and losses.
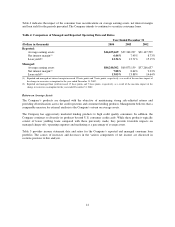
Marketing expense increased $47.8 million to $1.1 billion for the year ended December 31, 2003, compared to
the prior year. The increase in marketing expense resulted from favorable opportunities to originate higher credit
quality loans during 2003 combined with continued branding efforts. Operating expenses increased $223.3
million for the year ended December 31, 2003 to $3.7 billion from $3.5 billion for the prior year. The increases
were primarily due to increased credit and recovery efforts, investment in IT infrastructure to support future
growth and costs associated with the expansion of the Company’s enterprise risk management program and
systems to further strengthen internal controls.
Consolidated Statements of Income
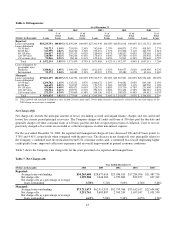
Net Interest Income
Net interest income is comprised of interest income and past-due fees earned and deemed collectible from the
Company’s consumer loans and income earned on securities, less interest expense on borrowings, which includes
interest-bearing deposits, borrowings from senior and subordinated notes and other borrowings.
Reported net interest income for the year ended December 31, 2004 increased $217.9 million, or 8%, to $3.0
billion compared to $2.8 billion for the prior year. The increase in net interest income is primarily a result of a
25% increase in the Company’s reported average earning assets for the year ended December 31, 2004 compared
to the prior year, offset by a decrease in earning asset yields. The reported net interest margin decreased 101
basis points to 6.44% for the year ended December 31, 2004 compared to 7.45% for the prior year. The decrease
was primarily due to a decrease in the reported loan yield, slightly offset by a decrease in the cost of funds. The
reported loan yield decreased 135 basis points to 12.36% for the year ended December 31, 2004, compared to
13.71% for the year ended December 31, 2003. The yield on reported loans decreased due to the Company’s
continued asset diversification beyond U.S. consumer credit cards and continued bias toward originating higher
credit quality, lower yielding loans when compared with the prior year. In addition, the Company increased the
average size of its liquidity portfolio by $3.5 billion during 2004. The yield on liquidity portfolio assets is lower
than those on consumer loans and served to reduce the overall earning assets yields.
Reported net interest income for the year ended December 31, 2003, was $2.8 billion compared to $2.7 billion
for 2002. Excluding the one-time impact of the change in recoveries estimate of $38.4 million for the year ended
December 31, 2002, net interest income for the year ended December 31, 2003 increased $27.6 million, or 1%
compared to the prior year. The slight increase in net interest income is primarily a result of a 20% increase in the
35