APS 2012 Annual Report Download - page 99
Download and view the complete annual report
Please find page 99 of the 2012 APS annual report below. You can navigate through the pages in the report by either clicking on the pages listed below, or by using the keyword search tool below to find specific information within the annual report.-
 1
1 -
2
-
3
-
4
-
5
-
6
-
7
-
8
-
9
-
10
-
11
-
12
-
13
-
14
-
15
-
16
-
17
-
18
-
19
-
20
-
21
-
22
-
23
-
24
-
25
-
26
-
27
-
28
-
29
-
30
-
31
-
32
-
33
-
34
-
35
-
36
-
37
-
38
-
39
-
40
-
41
-
42
-
43
-
44
-
45
-
46
-
47
-
48
-
49
-
50
-
51
-
52
-
53
-
54
-
55
-
56
-
57
-
58
-
59
-
60
-
61
-
62
-
63
-
64
-
65
-
66
-
67
-
68
-
69
-
70
-
71
-
72
-
73
-
74
-
75
-
76
-
77
-
78
-
79
-
80
-
81
-
82
-
83
-
84
-
85
-
86
-
87
-
88
-
 89
89 -
 90
90 -
 91
91 -
 92
92 -
 93
93 -
 94
94 -
 95
95 -
 96
96 -
 97
97 -
 98
98 -
 99
99 -
 100
100 -
 101
101 -
 102
102 -
 103
103 -
 104
104 -
 105
105 -
 106
106 -
 107
107 -
 108
108 -
 109
109 -
110
-
111
-
112
-
113
-
114
-
115
-
116
-
117
-
118
-
119
-
120
-
121
-
122
-
123
-
124
-
125
-
126
-
127
-
128
-
129
-
130
-
131
-
132
-
133
-
134
-
135
-
136
-
137
-
138
-
139
-
140
-
141
-
142
-
143
-
144
-
145
-
146
-
147
-
148
-
149
-
150
-
151
-
152
-
153
-
154
-
155
-
156
-
157
-
158
-
159
-
160
-
161
-
162
-
163
-
164
-
165
-
166
-
167
-
168
-
169
-
170
-
171
-
172
-
173
-
174
-
175
-
176
-
177
-
178
-
179
-
180
-
181
-
182
-
183
-
184
-
185
-
186
-
187
-
188
-
189
-
190
-
191
-
192
-
193
-
194
-
195
-
196
-
197
-
198
-
199
-
200
-
201
-
202
-
203
-
204
-
205
-
206
-
207
-
208
-
209
-
210
-
211
-
212
-
213
-
214
-
215
-
216
-
217
-
218
-
219
-
220
-
221
-
222
-
223
-
224
-
225
-
226
-
227
-
228
-
229
-
230
-
231
-
232
-
233
-
234
-
235
-
236
-
237
-
238
-
239
-
240
-
241
-
242
-
243
-
244
-
245
-
246
-
247
-
248
-
249
-
250
-
251
-
252
-
253
-
254
-
255
-
256
 |
 |

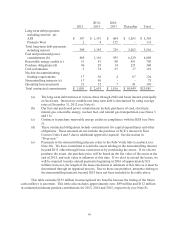
75
2012
2011
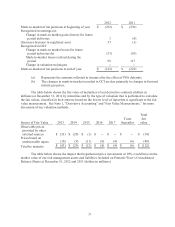
Mark-to-market of net positions at beginning of year
$ (222)
$ (239)
Recognized in earnings (a):
Change in mark-to-market gains (losses) for future
period deliveries
1
(4)
(Increase) decrease in regulatory asset
37
(1)
Recognized in OCI:
Change in mark-to-market losses for future
period deliveries (b)
(37)
(95)
Mark-to-market losses realized during the
period
99
117
Change in valuation techniques
--
--
Mark-to-market of net positions at end of year
$ (122)
$ (222)
(a) Represents the amounts reflected in income after the effect of PSA deferrals.
(b) The changes in mark-to-market recorded in OCI are due primarily to changes in forward
natural gas prices.
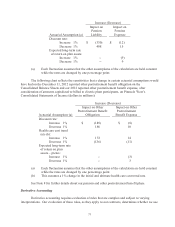
The table below shows the fair value of maturities of our derivative contracts (dollars in
millions) at December 31, 2012 by maturities and by the type of valuation that is performed to calculate
the fair values, classified in their entirety based on the lowest level of input that is significant to the fair
value measurement. See Note 1, “Derivative Accounting” and “Fair Value Measurements,” for more
discussion of our valuation methods.
Source of Fair Value
2013
2014
2015
2016
2017
Years
thereafter
Total
fair
value
Observable prices
provided by other
external sources
$ (53)
$ (20)
$ (1)
$ --
$ --
$ --
$ (74)
Prices based on
unobservable inputs
(10)
(9)
(11)
(8)
(4)
(6)
(48)
Total by maturity
$ (63)
$ (29)
$ (12)
$ (8)
$ (4)
$ (6)
$ (122)
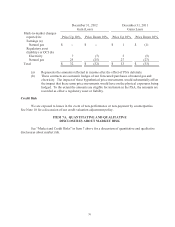
The table below shows the impact that hypothetical price movements of 10% would have on the
market value of our risk management assets and liabilities included on Pinnacle West’s Consolidated
Balance Sheets at December 31, 2012 and 2011 (dollars in millions):