APS 2012 Annual Report Download - page 134
Download and view the complete annual report
Please find page 134 of the 2012 APS annual report below. You can navigate through the pages in the report by either clicking on the pages listed below, or by using the keyword search tool below to find specific information within the annual report.-
 1
1 -
2
-
3
-
4
-
5
-
6
-
7
-
8
-
9
-
10
-
11
-
12
-
13
-
14
-
15
-
16
-
17
-
18
-
19
-
20
-
21
-
22
-
23
-
24
-
25
-
26
-
27
-
28
-
29
-
30
-
31
-
32
-
33
-
34
-
35
-
36
-
37
-
38
-
39
-
40
-
41
-
42
-
43
-
44
-
45
-
46
-
47
-
48
-
49
-
50
-
51
-
52
-
53
-
54
-
55
-
56
-
57
-
58
-
59
-
60
-
61
-
62
-
63
-
64
-
65
-
66
-
67
-
68
-
69
-
70
-
71
-
72
-
73
-
74
-
75
-
76
-
77
-
78
-
79
-
80
-
81
-
82
-
83
-
84
-
85
-
86
-
87
-
88
-
89
-
90
-
91
-
92
-
93
-
94
-
95
-
96
-
97
-
98
-
99
-
100
-
101
-
102
-
103
-
104
-
105
-
106
-
107
-
108
-
109
-
110
-
111
-
112
-
113
-
114
-
115
-
116
-
117
-
118
-
119
-
120
-
121
-
122
-
123
-
 124
124 -
 125
125 -
 126
126 -
 127
127 -
 128
128 -
 129
129 -
 130
130 -
 131
131 -
 132
132 -
 133
133 -
 134
134 -
 135
135 -
 136
136 -
 137
137 -
 138
138 -
 139
139 -
 140
140 -
 141
141 -
 142
142 -
 143
143 -
 144
144 -
145
-
146
-
147
-
148
-
149
-
150
-
151
-
152
-
153
-
154
-
155
-
156
-
157
-
158
-
159
-
160
-
161
-
162
-
163
-
164
-
165
-
166
-
167
-
168
-
169
-
170
-
171
-
172
-
173
-
174
-
175
-
176
-
177
-
178
-
179
-
180
-
181
-
182
-
183
-
184
-
185
-
186
-
187
-
188
-
189
-
190
-
191
-
192
-
193
-
194
-
195
-
196
-
197
-
198
-
199
-
200
-
201
-
202
-
203
-
204
-
205
-
206
-
207
-
208
-
209
-
210
-
211
-
212
-
213
-
214
-
215
-
216
-
217
-
218
-
219
-
220
-
221
-
222
-
223
-
224
-
225
-
226
-
227
-
228
-
229
-
230
-
231
-
232
-
233
-
234
-
235
-
236
-
237
-
238
-
239
-
240
-
241
-
242
-
243
-
244
-
245
-
246
-
247
-
248
-
249
-
250
-
251
-
252
-
253
-
254
-
255
-
256
 |
 |

PINNACLE WEST CAPITAL CORPORATION
NOTES TO CONSOLIDATED FINANCIAL STATEMENTS
109
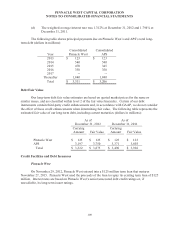
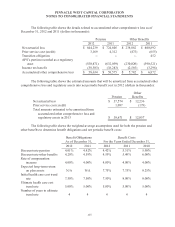
(d) The weighted-average interest rate was 1.312% at December 31, 2012 and 1.794% at
December 31, 2011.
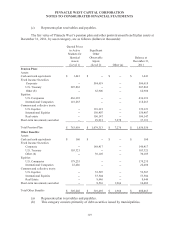
The following table shows principal payments due on Pinnacle West’s and APS’s total long-
term debt (dollars in millions):
Year
Consolidated
Pinnacle West
Consolidated
APS
2013
$ 123
$ 123
2014
540
540
2015
470
345
2016
358
358
2017
--
--
Thereafter
1,840
1,840
Total
$ 3,331
$ 3,206
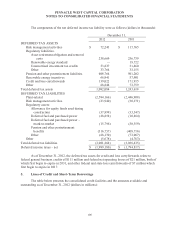
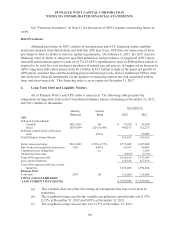
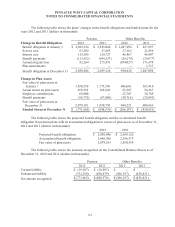
Debt Fair Value
Our long-term debt fair value estimates are based on quoted market prices for the same or
similar issues, and are classified within level 2 of the fair value hierarchy. Certain of our debt
instruments contain third-party credit enhancements and, in accordance with GAAP, we do not consider
the effect of these credit enhancements when determining fair value. The following table represents the
estimated fair value of our long-term debt, including current maturities (dollars in millions):
As of
December 31, 2012
As of
December 31, 2011
Carrying
Amount
Fair Value
Carrying
Amount
Fair Value
Pinnacle West
$ 125
$ 125
$ 125
$ 123
APS
3,197
3,750
3,371
3,803
Total
$ 3,322
$ 3,875
$ 3,496
$ 3,926
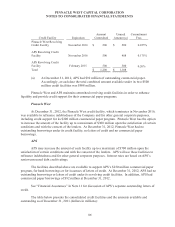
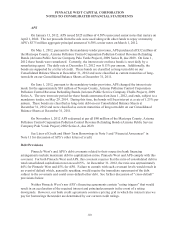
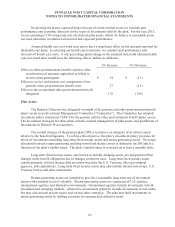
Credit Facilities and Debt Issuances
Pinnacle West
On November 29, 2012, Pinnacle West entered into a $125 million term loan that matures
November 27, 2015. Pinnacle West used the proceeds of the loan to repay its existing term loan of $125
million. Interest rates are based on Pinnacle West’s senior unsecured debt credit ratings or, if
unavailable, its long-term issuer ratings.