APS 2012 Annual Report Download - page 111
Download and view the complete annual report
Please find page 111 of the 2012 APS annual report below. You can navigate through the pages in the report by either clicking on the pages listed below, or by using the keyword search tool below to find specific information within the annual report.-
 1
1 -
2
-
3
-
4
-
5
-
6
-
7
-
8
-
9
-
10
-
11
-
12
-
13
-
14
-
15
-
16
-
17
-
18
-
19
-
20
-
21
-
22
-
23
-
24
-
25
-
26
-
27
-
28
-
29
-
30
-
31
-
32
-
33
-
34
-
35
-
36
-
37
-
38
-
39
-
40
-
41
-
42
-
43
-
44
-
45
-
46
-
47
-
48
-
49
-
50
-
51
-
52
-
53
-
54
-
55
-
56
-
57
-
58
-
59
-
60
-
61
-
62
-
63
-
64
-
65
-
66
-
67
-
68
-
69
-
70
-
71
-
72
-
73
-
74
-
75
-
76
-
77
-
78
-
79
-
80
-
81
-
82
-
83
-
84
-
85
-
86
-
87
-
88
-
89
-
90
-
91
-
92
-
93
-
94
-
95
-
96
-
97
-
98
-
99
-
100
-
 101
101 -
 102
102 -
 103
103 -
 104
104 -
 105
105 -
 106
106 -
 107
107 -
 108
108 -
 109
109 -
 110
110 -
 111
111 -
 112
112 -
 113
113 -
 114
114 -
 115
115 -
 116
116 -
 117
117 -
 118
118 -
 119
119 -
 120
120 -
 121
121 -
122
-
123
-
124
-
125
-
126
-
127
-
128
-
129
-
130
-
131
-
132
-
133
-
134
-
135
-
136
-
137
-
138
-
139
-
140
-
141
-
142
-
143
-
144
-
145
-
146
-
147
-
148
-
149
-
150
-
151
-
152
-
153
-
154
-
155
-
156
-
157
-
158
-
159
-
160
-
161
-
162
-
163
-
164
-
165
-
166
-
167
-
168
-
169
-
170
-
171
-
172
-
173
-
174
-
175
-
176
-
177
-
178
-
179
-
180
-
181
-
182
-
183
-
184
-
185
-
186
-
187
-
188
-
189
-
190
-
191
-
192
-
193
-
194
-
195
-
196
-
197
-
198
-
199
-
200
-
201
-
202
-
203
-
204
-
205
-
206
-
207
-
208
-
209
-
210
-
211
-
212
-
213
-
214
-
215
-
216
-
217
-
218
-
219
-
220
-
221
-
222
-
223
-
224
-
225
-
226
-
227
-
228
-
229
-
230
-
231
-
232
-
233
-
234
-
235
-
236
-
237
-
238
-
239
-
240
-
241
-
242
-
243
-
244
-
245
-
246
-
247
-
248
-
249
-
250
-
251
-
252
-
253
-
254
-
255
-
256
 |
 |

86
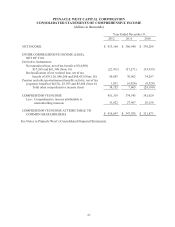
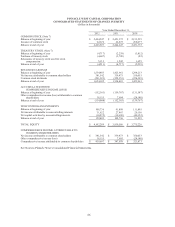
PINNACLE WEST CAPITAL CORPORATION
CONSOLIDATED STATEMENTS OF CHANGES IN EQUITY
(dollars in thousands)
Year Ended December 31,
2012
2011
2010
COMMON STOCK (Note 7)
Balance at beginning of year
$ 2,444,247
$ 2,421,372
$ 2,153,295
Issuance of common stock
22,676
22,875
268,077
Balance at end of year
2,466,923
2,444,247
2,421,372
TREASURY STOCK (Note 7)
Balance at beginning of year
(4,717)
(2,239)
(3,812)
Purchase of treasury stock
(4,607)
(3,720)
(82)
Reissuance of treasury stock used for stock
compensation
5,113
1,242
1,655
Balance at end of year
(4,211)
(4,717)
(2,239)
RETAINED EARNINGS
Balance at beginning of year
1,534,483
1,423,961
1,298,213
Net income attributable to common shareholders
381,542
339,473
350,053
Common stock dividends
(291,923)
(228,951)
(224,305)
Balance at end of year
1,624,102
1,534,483
1,423,961
ACCUMULATED OTHER
COMPREHENSIVE INCOME (LOSS)
Balance at beginning of year
(152,163)
(159,767)
(131,587)
Other comprehensive income (loss) attributable to common
shareholders
38,155
7,604
(28,180)
Balance at end of year
(114,008)
(152,163)
(159,767)
NONCONTROLLING INTERESTS
Balance at beginning of year
108,736
91,899
111,895
Net income attributable to noncontrolling interests
31,622
27,467
20,156
Net capital activities by noncontrolling interests
(10,875)
(10,630)
(40,152)
Balance at end of year
129,483
108,736
91,899
TOTAL EQUITY
$ 4,102,289
$ 3,930,586
$ 3,775,226
COMPREHENSIVE INCOME ATTRIBUTABLE TO
COMMON SHAREHOLDERS
Net income attributable to common shareholders
$ 381,542
$ 339,473
$ 350,053
Other comprehensive income (loss)
38,155
7,605
(28,180)
Comprehensive income attributable to common shareholders
$ 419,697
$ 347,078
$ 321,873
See Notes to Pinnacle West’s Consolidated Financial Statements.