APS 2012 Annual Report Download - page 89
Download and view the complete annual report
Please find page 89 of the 2012 APS annual report below. You can navigate through the pages in the report by either clicking on the pages listed below, or by using the keyword search tool below to find specific information within the annual report.-
 1
1 -
2
-
3
-
4
-
5
-
6
-
7
-
8
-
9
-
10
-
11
-
12
-
13
-
14
-
15
-
16
-
17
-
18
-
19
-
20
-
21
-
22
-
23
-
24
-
25
-
26
-
27
-
28
-
29
-
30
-
31
-
32
-
33
-
34
-
35
-
36
-
37
-
38
-
39
-
40
-
41
-
42
-
43
-
44
-
45
-
46
-
47
-
48
-
49
-
50
-
51
-
52
-
53
-
54
-
55
-
56
-
57
-
58
-
59
-
60
-
61
-
62
-
63
-
64
-
65
-
66
-
67
-
68
-
69
-
70
-
71
-
72
-
73
-
74
-
75
-
76
-
77
-
78
-
 79
79 -
 80
80 -
 81
81 -
 82
82 -
 83
83 -
 84
84 -
 85
85 -
 86
86 -
 87
87 -
 88
88 -
 89
89 -
 90
90 -
 91
91 -
 92
92 -
 93
93 -
 94
94 -
 95
95 -
 96
96 -
 97
97 -
 98
98 -
 99
99 -
100
-
101
-
102
-
103
-
104
-
105
-
106
-
107
-
108
-
109
-
110
-
111
-
112
-
113
-
114
-
115
-
116
-
117
-
118
-
119
-
120
-
121
-
122
-
123
-
124
-
125
-
126
-
127
-
128
-
129
-
130
-
131
-
132
-
133
-
134
-
135
-
136
-
137
-
138
-
139
-
140
-
141
-
142
-
143
-
144
-
145
-
146
-
147
-
148
-
149
-
150
-
151
-
152
-
153
-
154
-
155
-
156
-
157
-
158
-
159
-
160
-
161
-
162
-
163
-
164
-
165
-
166
-
167
-
168
-
169
-
170
-
171
-
172
-
173
-
174
-
175
-
176
-
177
-
178
-
179
-
180
-
181
-
182
-
183
-
184
-
185
-
186
-
187
-
188
-
189
-
190
-
191
-
192
-
193
-
194
-
195
-
196
-
197
-
198
-
199
-
200
-
201
-
202
-
203
-
204
-
205
-
206
-
207
-
208
-
209
-
210
-
211
-
212
-
213
-
214
-
215
-
216
-
217
-
218
-
219
-
220
-
221
-
222
-
223
-
224
-
225
-
226
-
227
-
228
-
229
-
230
-
231
-
232
-
233
-
234
-
235
-
236
-
237
-
238
-
239
-
240
-
241
-
242
-
243
-
244
-
245
-
246
-
247
-
248
-
249
-
250
-
251
-
252
-
253
-
254
-
255
-
256
 |
 |
65
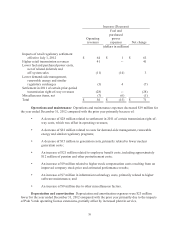
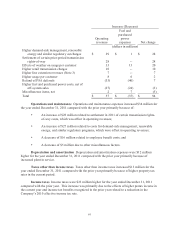
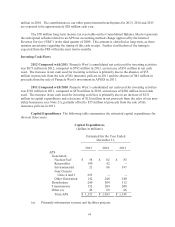
Generation capital expenditures are comprised of various improvements to APS’s existing fossil
and nuclear plants. Examples of the types of projects included in this category are additions, upgrades
and capital replacements of various power plant equipment, such as turbines, boilers and environmental
equipment. For purposes of this table, we have assumed the consummation of APS’s purchase of SCE’s
interest in Four Corners Units 4 and 5 and the subsequent shutdown of Units 1-3, as discussed in the
“Overview” section above. As a result, we included the estimated $253 million purchase price under
Generation and have not included environmental expenditures for Units 1-3. We have not included
estimated costs for Cholla’s compliance with EPA’s Arizona regional haze rule since we have
challenged the rule judicially and are considering our future options with respect to that plant if the rule
is upheld. We are also monitoring the status of certain environmental matters, which, depending on
their final outcome, could require modification to our environmental expenditures.
Distribution and transmission capital expenditures are comprised of infrastructure additions and
upgrades, capital replacements, and new customer construction. Examples of the types of projects
included in the forecast include power lines, substations, and line extensions to new residential and
commercial developments.
Capital expenditures will be funded with internally generated cash and external financings,
which may include issuances of long-term debt and Pinnacle West common stock.
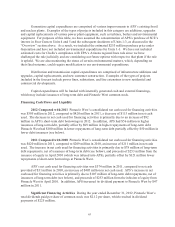
Financing Cash Flows and Liquidity
2012 Compared with 2011 Pinnacle West’s consolidated net cash used for financing activities
was $305 million in 2012, compared to $420 million in 2011, a decrease of $115 million in net cash
used. The decrease in net cash used for financing activities is primarily due to an increase of $92
million in APS’s short-term debt borrowings in 2012. In addition, APS had $56 million in higher
issuances of long-term debt, partially offset by $99 million in higher repayments of long-term debt.
Pinnacle West had $100 million in lower repayments of long-term debt partially offset by $50 million in
lower debt issuances (see below).
2011 Compared with 2010 Pinnacle West’s consolidated net cash used for financing activities
was $420 million in 2011, compared to $209 million in 2010, an increase of $211 million in net cash
used. The increase in net cash used for financing activities is primarily due to $78 million of long-term
debt repayments, net of issuances of long-term debt (see below), and proceeds of $253 million from the
issuance of equity in April 2010 (which was infused into APS), partially offset by $121 million lower
repayments of short-term borrowings at Pinnacle West.
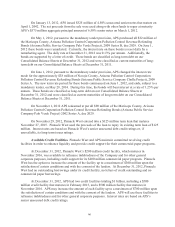
APS’s net cash used for financing activities was $374 million in 2011, compared to net cash
provided of $31 million in 2010, an increase of $405 million in net cash used. APS’s increase in net
cash used for financing activities is primarily due to $107 million of long-term debt repayments, net of
issuances of long-term debt (see below), and proceeds of $253 million from the infusion of equity from
Pinnacle West in April 2010. In addition, APS increased its dividend payment to Pinnacle West by $47
million in 2011.
Significant Financing Activities During the year ended December 31, 2012, Pinnacle West’s
total dividends paid per share of common stock was $2.12 per share, which resulted in dividend
payments of $225 million.