APS 2012 Annual Report Download - page 84
Download and view the complete annual report
Please find page 84 of the 2012 APS annual report below. You can navigate through the pages in the report by either clicking on the pages listed below, or by using the keyword search tool below to find specific information within the annual report.-
 1
1 -
2
-
3
-
4
-
5
-
6
-
7
-
8
-
9
-
10
-
11
-
12
-
13
-
14
-
15
-
16
-
17
-
18
-
19
-
20
-
21
-
22
-
23
-
24
-
25
-
26
-
27
-
28
-
29
-
30
-
31
-
32
-
33
-
34
-
35
-
36
-
37
-
38
-
39
-
40
-
41
-
42
-
43
-
44
-
45
-
46
-
47
-
48
-
49
-
50
-
51
-
52
-
53
-
54
-
55
-
56
-
57
-
58
-
59
-
60
-
61
-
62
-
63
-
64
-
65
-
66
-
67
-
68
-
69
-
70
-
71
-
72
-
73
-
 74
74 -
 75
75 -
 76
76 -
 77
77 -
 78
78 -
 79
79 -
 80
80 -
 81
81 -
 82
82 -
 83
83 -
 84
84 -
 85
85 -
 86
86 -
 87
87 -
 88
88 -
 89
89 -
 90
90 -
 91
91 -
 92
92 -
 93
93 -
 94
94 -
95
-
96
-
97
-
98
-
99
-
100
-
101
-
102
-
103
-
104
-
105
-
106
-
107
-
108
-
109
-
110
-
111
-
112
-
113
-
114
-
115
-
116
-
117
-
118
-
119
-
120
-
121
-
122
-
123
-
124
-
125
-
126
-
127
-
128
-
129
-
130
-
131
-
132
-
133
-
134
-
135
-
136
-
137
-
138
-
139
-
140
-
141
-
142
-
143
-
144
-
145
-
146
-
147
-
148
-
149
-
150
-
151
-
152
-
153
-
154
-
155
-
156
-
157
-
158
-
159
-
160
-
161
-
162
-
163
-
164
-
165
-
166
-
167
-
168
-
169
-
170
-
171
-
172
-
173
-
174
-
175
-
176
-
177
-
178
-
179
-
180
-
181
-
182
-
183
-
184
-
185
-
186
-
187
-
188
-
189
-
190
-
191
-
192
-
193
-
194
-
195
-
196
-
197
-
198
-
199
-
200
-
201
-
202
-
203
-
204
-
205
-
206
-
207
-
208
-
209
-
210
-
211
-
212
-
213
-
214
-
215
-
216
-
217
-
218
-
219
-
220
-
221
-
222
-
223
-
224
-
225
-
226
-
227
-
228
-
229
-
230
-
231
-
232
-
233
-
234
-
235
-
236
-
237
-
238
-
239
-
240
-
241
-
242
-
243
-
244
-
245
-
246
-
247
-
248
-
249
-
250
-
251
-
252
-
253
-
254
-
255
-
256
 |
 |

60
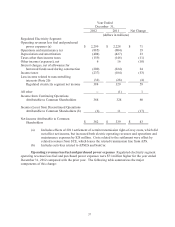
Year Ended
December 31,
Net Change
2011
2010
(dollars in millions)
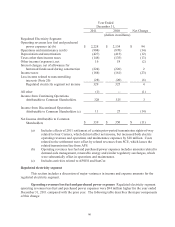
Regulated Electricity Segment:
Operating revenues less fuel and purchased
power expenses (a) (b)
$ 2,228
$ 2,134
$ 94
Operations and maintenance (a) (b)
(904)
(870)
(34)
Depreciation and amortization
(427)
(415)
(12)
Taxes other than income taxes
(148)
(135)
(13)
Other income (expenses), net
16
18
(2)
Interest charges, net of allowance for
borrowed funds used during construction
(224)
(226)
2
Income taxes
(184)
(161)
(23)
Less income related to noncontrolling
interests (Note 20)
(28) (20) (8)
Regulated electricity segment net income
329
325
4
All other
(1)
--
(1)
Income from Continuing Operations
Attributable to Common Shareholders
328
325
3
Income from Discontinued Operations
Attributable to Common Shareholders (c)
11
25
(14)
Net Income Attributable to Common
Shareholders
$ 339 $ 350 $ (11)
(a) Includes effects of 2011 settlement of certain prior-period transmission rights-of-way
related to Four Corners, which did not affect net income, but increased both electric
operating revenues and operations and maintenance expenses by $28 million. Costs
related to the settlement were offset by related revenues from SCE, which leases the
related transmission line from APS.
(b) Operating revenues less fuel and purchased power expenses includes amounts related to
demand-side management, renewable energy and similar regulatory surcharges, which
were substantially offset in operations and maintenance.
(c) Includes activities related to APSES and SunCor.
Regulated electricity segment
This section includes a discussion of major variances in income and expense amounts for the
regulated electricity segment.
Operating revenues less fuel and purchased power expenses Regulated electricity segment
operating revenues less fuel and purchased power expenses were $94 million higher for the year ended
December 31, 2011 compared with the prior year. The following table describes the major components
of this change: