APS 2012 Annual Report Download - page 88
Download and view the complete annual report
Please find page 88 of the 2012 APS annual report below. You can navigate through the pages in the report by either clicking on the pages listed below, or by using the keyword search tool below to find specific information within the annual report.-
 1
1 -
2
-
3
-
4
-
5
-
6
-
7
-
8
-
9
-
10
-
11
-
12
-
13
-
14
-
15
-
16
-
17
-
18
-
19
-
20
-
21
-
22
-
23
-
24
-
25
-
26
-
27
-
28
-
29
-
30
-
31
-
32
-
33
-
34
-
35
-
36
-
37
-
38
-
39
-
40
-
41
-
42
-
43
-
44
-
45
-
46
-
47
-
48
-
49
-
50
-
51
-
52
-
53
-
54
-
55
-
56
-
57
-
58
-
59
-
60
-
61
-
62
-
63
-
64
-
65
-
66
-
67
-
68
-
69
-
70
-
71
-
72
-
73
-
74
-
75
-
76
-
77
-
 78
78 -
 79
79 -
 80
80 -
 81
81 -
 82
82 -
 83
83 -
 84
84 -
 85
85 -
 86
86 -
 87
87 -
 88
88 -
 89
89 -
 90
90 -
 91
91 -
 92
92 -
 93
93 -
 94
94 -
 95
95 -
 96
96 -
 97
97 -
 98
98 -
99
-
100
-
101
-
102
-
103
-
104
-
105
-
106
-
107
-
108
-
109
-
110
-
111
-
112
-
113
-
114
-
115
-
116
-
117
-
118
-
119
-
120
-
121
-
122
-
123
-
124
-
125
-
126
-
127
-
128
-
129
-
130
-
131
-
132
-
133
-
134
-
135
-
136
-
137
-
138
-
139
-
140
-
141
-
142
-
143
-
144
-
145
-
146
-
147
-
148
-
149
-
150
-
151
-
152
-
153
-
154
-
155
-
156
-
157
-
158
-
159
-
160
-
161
-
162
-
163
-
164
-
165
-
166
-
167
-
168
-
169
-
170
-
171
-
172
-
173
-
174
-
175
-
176
-
177
-
178
-
179
-
180
-
181
-
182
-
183
-
184
-
185
-
186
-
187
-
188
-
189
-
190
-
191
-
192
-
193
-
194
-
195
-
196
-
197
-
198
-
199
-
200
-
201
-
202
-
203
-
204
-
205
-
206
-
207
-
208
-
209
-
210
-
211
-
212
-
213
-
214
-
215
-
216
-
217
-
218
-
219
-
220
-
221
-
222
-
223
-
224
-
225
-
226
-
227
-
228
-
229
-
230
-
231
-
232
-
233
-
234
-
235
-
236
-
237
-
238
-
239
-
240
-
241
-
242
-
243
-
244
-
245
-
246
-
247
-
248
-
249
-
250
-
251
-
252
-
253
-
254
-
255
-
256
 |
 |

64
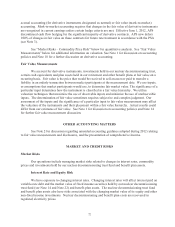
million in 2010. The contributions to our other postretirement benefit plans for 2013, 2014 and 2015
are expected to be approximately $20 million each year.
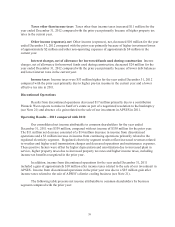
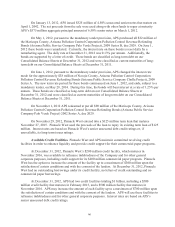
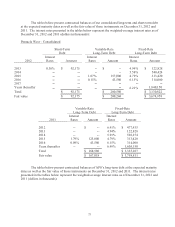
The $70 million long-term income tax receivable on the Consolidated Balance Sheets represents
the anticipated refunds related to an APS tax accounting method change approved by the Internal
Revenue Service (“IRS”) in the third quarter of 2009. This amount is classified as long-term, as there
remains uncertainty regarding the timing of this cash receipt. Further clarification of the timing is
expected from the IRS within the next twelve months.
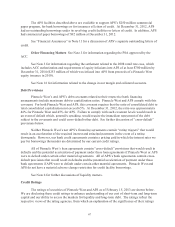
Investing Cash Flows
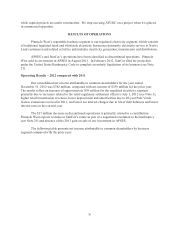
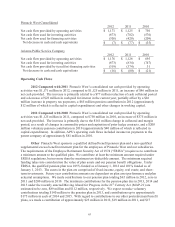
2012 Compared with 2011 Pinnacle West’s consolidated net cash used for investing activities
was $873 million in 2012, compared to $782 million in 2011, an increase of $91 million in net cash
used. The increase in net cash used for investing activities is primarily due to the absence of $55
million in proceeds from the sale of life insurance policies in 2011 and the absence of $45 million in
proceeds from the sale of Pinnacle West’s investment in APSES in 2011.
2011 Compared with 2010 Pinnacle West’s consolidated net cash used for investing activities
was $782 million in 2011, compared to $576 million in 2010, an increase of $206 million in net cash
used. The increase in net cash used for investing activities is primarily due to an increase of $131
million in capital expenditures and a decrease of $126 million in net proceeds from the sales of our non-
utility businesses (see Note 21), partially offset by $55 million of proceeds from the sale of life
insurance policies in 2011.
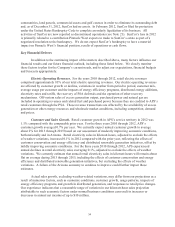
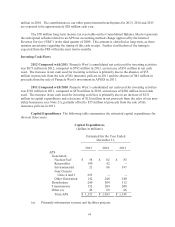
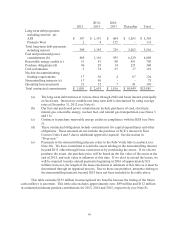
Capital Expenditures The following table summarizes the estimated capital expenditures for
the next three years:
Capital Expenditures
(dollars in millions)
Estimated for the Year Ended
December 31,
2013
2014
2015
APS
Generation:
Nuclear Fuel
$ 58
$ 82
$ 83
Renewables
190
42
--
Environmental
21
86
187
Four Corners
Units 4 and 5
253
--
--
Other Generation
142
246
340
Distribution
260
304
312
Transmission
152
204
200
Other (a)
45
69
66
Total APS
$ 1,121
$ 1,033
$ 1,188
(a) Primarily information systems and facilities projects.