APS 2012 Annual Report Download - page 156
Download and view the complete annual report
Please find page 156 of the 2012 APS annual report below. You can navigate through the pages in the report by either clicking on the pages listed below, or by using the keyword search tool below to find specific information within the annual report.-
 1
1 -
2
-
3
-
4
-
5
-
6
-
7
-
8
-
9
-
10
-
11
-
12
-
13
-
14
-
15
-
16
-
17
-
18
-
19
-
20
-
21
-
22
-
23
-
24
-
25
-
26
-
27
-
28
-
29
-
30
-
31
-
32
-
33
-
34
-
35
-
36
-
37
-
38
-
39
-
40
-
41
-
42
-
43
-
44
-
45
-
46
-
47
-
48
-
49
-
50
-
51
-
52
-
53
-
54
-
55
-
56
-
57
-
58
-
59
-
60
-
61
-
62
-
63
-
64
-
65
-
66
-
67
-
68
-
69
-
70
-
71
-
72
-
73
-
74
-
75
-
76
-
77
-
78
-
79
-
80
-
81
-
82
-
83
-
84
-
85
-
86
-
87
-
88
-
89
-
90
-
91
-
92
-
93
-
94
-
95
-
96
-
97
-
98
-
99
-
100
-
101
-
102
-
103
-
104
-
105
-
106
-
107
-
108
-
109
-
110
-
111
-
112
-
113
-
114
-
115
-
116
-
117
-
118
-
119
-
120
-
121
-
122
-
123
-
124
-
125
-
126
-
127
-
128
-
129
-
130
-
131
-
132
-
133
-
134
-
135
-
136
-
137
-
138
-
139
-
140
-
141
-
142
-
143
-
144
-
145
-
 146
146 -
 147
147 -
 148
148 -
 149
149 -
 150
150 -
 151
151 -
 152
152 -
 153
153 -
 154
154 -
 155
155 -
 156
156 -
 157
157 -
 158
158 -
 159
159 -
 160
160 -
 161
161 -
 162
162 -
 163
163 -
 164
164 -
 165
165 -
 166
166 -
167
-
168
-
169
-
170
-
171
-
172
-
173
-
174
-
175
-
176
-
177
-
178
-
179
-
180
-
181
-
182
-
183
-
184
-
185
-
186
-
187
-
188
-
189
-
190
-
191
-
192
-
193
-
194
-
195
-
196
-
197
-
198
-
199
-
200
-
201
-
202
-
203
-
204
-
205
-
206
-
207
-
208
-
209
-
210
-
211
-
212
-
213
-
214
-
215
-
216
-
217
-
218
-
219
-
220
-
221
-
222
-
223
-
224
-
225
-
226
-
227
-
228
-
229
-
230
-
231
-
232
-
233
-
234
-
235
-
236
-
237
-
238
-
239
-
240
-
241
-
242
-
243
-
244
-
245
-
246
-
247
-
248
-
249
-
250
-
251
-
252
-
253
-
254
-
255
-
256
 |
 |
PINNACLE WEST CAPITAL CORPORATION
NOTES TO CONSOLIDATED FINANCIAL STATEMENTS
131
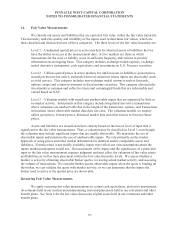
14. Fair Value Measurements
We classify our assets and liabilities that are carried at fair value within the fair value hierarchy.
This hierarchy ranks the quality and reliability of the inputs used to determine fair values, which are
then classified and disclosed in one of three categories. The three levels of the fair value hierarchy are:
Level 1 – Unadjusted quoted prices in active markets for identical assets or liabilities that we
have the ability to access at the measurement date. Active markets are those in which
transactions for the asset or liability occur in sufficient frequency and volume to provide
information on an ongoing basis. This category includes exchange-traded equities, exchange-
traded derivative instruments, cash equivalents, and investments in U.S. Treasury securities.
Level 2 – Utilizes quoted prices in active markets for similar assets or liabilities; quoted prices
in markets that are not active; and model-derived valuations whose inputs are observable (such
as yield curves). This category includes non-exchange traded contracts such as forwards,
options, swaps and certain investments in fixed income securities. This category also includes
investments in common and collective trusts and commingled funds that are redeemable and
valued based on NAV.
Level 3 – Valuation models with significant unobservable inputs that are supported by little or
no market activity. Instruments in this category include long-dated derivative transactions
where valuations are unobservable due to the length of the transaction, options, and transactions
in locations where observable market data does not exist. The valuation models we employ
utilize spot prices, forward prices, historical market data and other factors to forecast future
prices.
Assets and liabilities are classified in their entirety based on the lowest level of input that is
significant to the fair value measurement. Thus, a valuation may be classified in Level 3 even though
the valuation may include significant inputs that are readily observable. We maximize the use of
observable inputs and minimize the use of unobservable inputs. We rely primarily on the market
approach of using prices and other market information for identical and/or comparable assets and
liabilities. If market data is not readily available, inputs may reflect our own assumptions about the
inputs market participants would use. Our assessment of the inputs and the significance of a particular
input to the fair value measurement requires judgment and may affect the valuation of fair value assets
and liabilities as well as their placement within the fair value hierarchy levels. We assess whether a
market is active by obtaining observable broker quotes, reviewing actual market activity, and assessing
the volume of transactions. We consider broker quotes observable inputs when the quote is binding on
the broker, we can validate the quote with market activity, or we can determine that the inputs the
broker used to arrive at the quoted price are observable.
Recurring Fair Value Measurements
We apply recurring fair value measurements to certain cash equivalents, derivative instruments,
investments held in our nuclear decommissioning trust and plan assets held in our retirement and other
benefit plans. See Note 8 for the fair value discussion of plan assets held in our retirement and other
benefit plans.