APS 2012 Annual Report Download - page 172
Download and view the complete annual report
Please find page 172 of the 2012 APS annual report below. You can navigate through the pages in the report by either clicking on the pages listed below, or by using the keyword search tool below to find specific information within the annual report.-
 1
1 -
2
-
3
-
4
-
5
-
6
-
7
-
8
-
9
-
10
-
11
-
12
-
13
-
14
-
15
-
16
-
17
-
18
-
19
-
20
-
21
-
22
-
23
-
24
-
25
-
26
-
27
-
28
-
29
-
30
-
31
-
32
-
33
-
34
-
35
-
36
-
37
-
38
-
39
-
40
-
41
-
42
-
43
-
44
-
45
-
46
-
47
-
48
-
49
-
50
-
51
-
52
-
53
-
54
-
55
-
56
-
57
-
58
-
59
-
60
-
61
-
62
-
63
-
64
-
65
-
66
-
67
-
68
-
69
-
70
-
71
-
72
-
73
-
74
-
75
-
76
-
77
-
78
-
79
-
80
-
81
-
82
-
83
-
84
-
85
-
86
-
87
-
88
-
89
-
90
-
91
-
92
-
93
-
94
-
95
-
96
-
97
-
98
-
99
-
100
-
101
-
102
-
103
-
104
-
105
-
106
-
107
-
108
-
109
-
110
-
111
-
112
-
113
-
114
-
115
-
116
-
117
-
118
-
119
-
120
-
121
-
122
-
123
-
124
-
125
-
126
-
127
-
128
-
129
-
130
-
131
-
132
-
133
-
134
-
135
-
136
-
137
-
138
-
139
-
140
-
141
-
142
-
143
-
144
-
145
-
146
-
147
-
148
-
149
-
150
-
151
-
152
-
153
-
154
-
155
-
156
-
157
-
158
-
159
-
160
-
161
-
 162
162 -
 163
163 -
 164
164 -
 165
165 -
 166
166 -
 167
167 -
 168
168 -
 169
169 -
 170
170 -
 171
171 -
 172
172 -
 173
173 -
 174
174 -
 175
175 -
 176
176 -
 177
177 -
 178
178 -
 179
179 -
 180
180 -
 181
181 -
 182
182 -
183
-
184
-
185
-
186
-
187
-
188
-
189
-
190
-
191
-
192
-
193
-
194
-
195
-
196
-
197
-
198
-
199
-
200
-
201
-
202
-
203
-
204
-
205
-
206
-
207
-
208
-
209
-
210
-
211
-
212
-
213
-
214
-
215
-
216
-
217
-
218
-
219
-
220
-
221
-
222
-
223
-
224
-
225
-
226
-
227
-
228
-
229
-
230
-
231
-
232
-
233
-
234
-
235
-
236
-
237
-
238
-
239
-
240
-
241
-
242
-
243
-
244
-
245
-
246
-
247
-
248
-
249
-
250
-
251
-
252
-
253
-
254
-
255
-
256
 |
 |

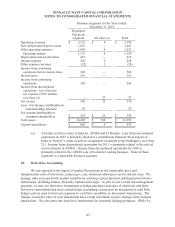
PINNACLE WEST CAPITAL CORPORATION
NOTES TO CONSOLIDATED FINANCIAL STATEMENTS
147
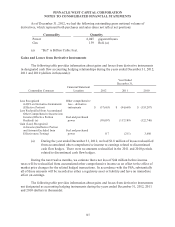
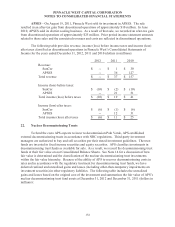
As of December 31, 2012, we had the following outstanding gross notional volume of
derivatives, which represent both purchases and sales (does not reflect net position):
Commodity
Quantity
Power
8,045
gigawatt hours
Gas
139
Bcfs (a)
(a) “Bcf” is Billion Cubic Feet.
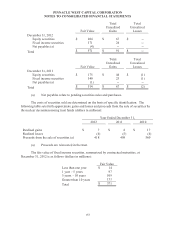
Gains and Losses from Derivative Instruments
The following table provides information about gains and losses from derivative instruments
in designated cash flow accounting hedging relationships during the years ended December 31, 2012,
2011 and 2010 (dollars in thousands):
Year Ended
December 31,
Commodity Contracts
Financial Statement
Location 2012 2011 2010
Loss Recognized
in OCI on Derivative Instruments
(Effective Portion)
Other comprehensive
loss – derivative
instruments
$ (37,663)
$ (94,660)
$ (155,287)
Loss Reclassified from Accumulated
Other Comprehensive Income into
Income (Effective Portion
Realized) (a)
Fuel and purchased
power
(99,007)
(117,189)
(122,740)
Gain (Loss) Recognized
in Income (Ineffective Portion
and Amount Excluded from
Effectiveness Testing)
Fuel and purchased
power
117
(211)
3,680
(a) During the year ended December 31, 2012, we had $1.8 million of losses reclassified
from accumulated other comprehensive income to earnings related to discontinued
cash flow hedges. There were no amounts reclassified in the 2011 and 2010 periods
related to discontinued cash flow hedges.
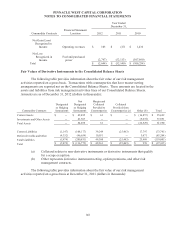
During the next twelve months, we estimate that a net loss of $44 million before income
taxes will be reclassified from accumulated other comprehensive income as an offset to the effect of
market price changes for the related hedged transactions. In accordance with the PSA, substantially
all of these amounts will be recorded as either a regulatory asset or liability and have no immediate
effect on earnings.
The following table provides information about gains and losses from derivative instruments
not designated as accounting hedging instruments during the years ended December 31, 2012, 2011
and 2010 (dollars in thousands):