APS 2012 Annual Report Download - page 73
Download and view the complete annual report
Please find page 73 of the 2012 APS annual report below. You can navigate through the pages in the report by either clicking on the pages listed below, or by using the keyword search tool below to find specific information within the annual report.-
 1
1 -
2
-
3
-
4
-
5
-
6
-
7
-
8
-
9
-
10
-
11
-
12
-
13
-
14
-
15
-
16
-
17
-
18
-
19
-
20
-
21
-
22
-
23
-
24
-
25
-
26
-
27
-
28
-
29
-
30
-
31
-
32
-
33
-
34
-
35
-
36
-
37
-
38
-
39
-
40
-
41
-
42
-
43
-
44
-
45
-
46
-
47
-
48
-
49
-
50
-
51
-
52
-
53
-
54
-
55
-
56
-
57
-
58
-
59
-
60
-
61
-
62
-
 63
63 -
 64
64 -
 65
65 -
 66
66 -
 67
67 -
 68
68 -
 69
69 -
 70
70 -
 71
71 -
 72
72 -
 73
73 -
 74
74 -
 75
75 -
 76
76 -
 77
77 -
 78
78 -
 79
79 -
 80
80 -
 81
81 -
 82
82 -
 83
83 -
84
-
85
-
86
-
87
-
88
-
89
-
90
-
91
-
92
-
93
-
94
-
95
-
96
-
97
-
98
-
99
-
100
-
101
-
102
-
103
-
104
-
105
-
106
-
107
-
108
-
109
-
110
-
111
-
112
-
113
-
114
-
115
-
116
-
117
-
118
-
119
-
120
-
121
-
122
-
123
-
124
-
125
-
126
-
127
-
128
-
129
-
130
-
131
-
132
-
133
-
134
-
135
-
136
-
137
-
138
-
139
-
140
-
141
-
142
-
143
-
144
-
145
-
146
-
147
-
148
-
149
-
150
-
151
-
152
-
153
-
154
-
155
-
156
-
157
-
158
-
159
-
160
-
161
-
162
-
163
-
164
-
165
-
166
-
167
-
168
-
169
-
170
-
171
-
172
-
173
-
174
-
175
-
176
-
177
-
178
-
179
-
180
-
181
-
182
-
183
-
184
-
185
-
186
-
187
-
188
-
189
-
190
-
191
-
192
-
193
-
194
-
195
-
196
-
197
-
198
-
199
-
200
-
201
-
202
-
203
-
204
-
205
-
206
-
207
-
208
-
209
-
210
-
211
-
212
-
213
-
214
-
215
-
216
-
217
-
218
-
219
-
220
-
221
-
222
-
223
-
224
-
225
-
226
-
227
-
228
-
229
-
230
-
231
-
232
-
233
-
234
-
235
-
236
-
237
-
238
-
239
-
240
-
241
-
242
-
243
-
244
-
245
-
246
-
247
-
248
-
249
-
250
-
251
-
252
-
253
-
254
-
255
-
256
 |
 |

49
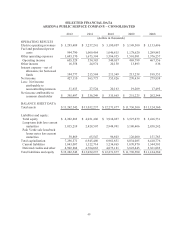
SELECTED FINANCIAL DATA
ARIZONA PUBLIC SERVICE COMPANY – CONSOLIDATED
2012
2011
2010
2009
2008
(dollars in thousands)
OPERATING RESULTS
Electric operating revenues
$ 3,293,489
$ 3,237,241
$ 3,180,807
$ 3,149,500
$ 3,133,496
Fuel and purchased power
costs
994,790
1,009,464
1,046,815
1,178,620
1,289,883
Other operating expenses
1,693,170
1,673,394
1,584,955
1,501,081
1,376,257
Operating income
605,529
554,383
549,037
469,799
467,356
Other income
16,358
24,974
20,138
13,893
836
Interest expense – net of
allowance for borrowed
funds
194,777
215,584
213,349
213,258
188,353
Net income
427,110
363,773
355,826
270,434
279,839
Less: Net income
attributable to
noncontrolling interests
31,613 27,524 20,163 19,209 17,495
Net income attributable to
common shareholder
$ 395,497 $ 336,249 $ 335,663 $ 251,225 $ 262,344
BALANCE SHEET DATA
Total assets
$ 13,242,542
$ 13,032,237
$ 12,271,877
$ 11,730,500
$ 11,124,360
Liabilities and equity:
Total equity
$ 4,222,483
$ 4,051,406
$ 3,916,037
$ 3,527,679
$ 3,416,751
Long-term debt less current
maturities
3,035,219
2,828,507
2,948,991
3,180,406
2,850,242
Palo Verde sale leaseback
lessor notes less current
maturities
38,869 65,547 96,803 126,000 151,783
Total capitalization
7,296,571
6,945,460
6,961,831
6,834,085
6,418,776
Current liabilities
1,043,087
1,322,714
1,234,865
1,070,970
1,344,501
Deferred credits and other
4,902,884
4,764,063
4,075,181
3,825,445
3,361,083
Total liabilities and equity
$ 13,242,542
$ 13,032,237
$ 12,271,877
$ 11,730,500
$ 11,124,360