APS 2012 Annual Report Download - page 56
Download and view the complete annual report
Please find page 56 of the 2012 APS annual report below. You can navigate through the pages in the report by either clicking on the pages listed below, or by using the keyword search tool below to find specific information within the annual report.-
 1
1 -
2
-
3
-
4
-
5
-
6
-
7
-
8
-
9
-
10
-
11
-
12
-
13
-
14
-
15
-
16
-
17
-
18
-
19
-
20
-
21
-
22
-
23
-
24
-
25
-
26
-
27
-
28
-
29
-
30
-
31
-
32
-
33
-
34
-
35
-
36
-
37
-
38
-
39
-
40
-
41
-
42
-
43
-
44
-
45
-
 46
46 -
 47
47 -
 48
48 -
 49
49 -
 50
50 -
 51
51 -
 52
52 -
 53
53 -
 54
54 -
 55
55 -
 56
56 -
 57
57 -
 58
58 -
 59
59 -
 60
60 -
 61
61 -
 62
62 -
 63
63 -
 64
64 -
 65
65 -
 66
66 -
67
-
68
-
69
-
70
-
71
-
72
-
73
-
74
-
75
-
76
-
77
-
78
-
79
-
80
-
81
-
82
-
83
-
84
-
85
-
86
-
87
-
88
-
89
-
90
-
91
-
92
-
93
-
94
-
95
-
96
-
97
-
98
-
99
-
100
-
101
-
102
-
103
-
104
-
105
-
106
-
107
-
108
-
109
-
110
-
111
-
112
-
113
-
114
-
115
-
116
-
117
-
118
-
119
-
120
-
121
-
122
-
123
-
124
-
125
-
126
-
127
-
128
-
129
-
130
-
131
-
132
-
133
-
134
-
135
-
136
-
137
-
138
-
139
-
140
-
141
-
142
-
143
-
144
-
145
-
146
-
147
-
148
-
149
-
150
-
151
-
152
-
153
-
154
-
155
-
156
-
157
-
158
-
159
-
160
-
161
-
162
-
163
-
164
-
165
-
166
-
167
-
168
-
169
-
170
-
171
-
172
-
173
-
174
-
175
-
176
-
177
-
178
-
179
-
180
-
181
-
182
-
183
-
184
-
185
-
186
-
187
-
188
-
189
-
190
-
191
-
192
-
193
-
194
-
195
-
196
-
197
-
198
-
199
-
200
-
201
-
202
-
203
-
204
-
205
-
206
-
207
-
208
-
209
-
210
-
211
-
212
-
213
-
214
-
215
-
216
-
217
-
218
-
219
-
220
-
221
-
222
-
223
-
224
-
225
-
226
-
227
-
228
-
229
-
230
-
231
-
232
-
233
-
234
-
235
-
236
-
237
-
238
-
239
-
240
-
241
-
242
-
243
-
244
-
245
-
246
-
247
-
248
-
249
-
250
-
251
-
252
-
253
-
254
-
255
-
256
 |
 |
32
retail rate case settlement agreement also established energy efficiency goals for APS that extended
through 2012, subjecting APS to energy efficiency requirements slightly greater for the first two of
those years than required under the rules described above.
APS must also meet certain distributed energy requirements. A portion of APS’s total
renewable energy requirement must be met with an increasing percentage of distributed energy
resources (generally, small scale renewable technologies located on customers' properties). The
distributed energy requirement was 25% of the overall RES requirement of 3% in 2011 and increased
to 30% of the applicable RES requirement for 2012 and subsequent years. Customer participation in
distributed energy programs would result in lower demand, since customers would be meeting some or
all of their own energy needs.
Reduced demand due to these energy efficiency and distributed energy requirements, unless
substantially offset through ratemaking mechanisms, could have a material adverse impact on APS’s
financial condition, results of operations and cash flows. Additionally, higher than anticipated
penetration of distributed energy may also cause portions of APS’s existing resource fleet, such as
coal, to become uneconomic or operationally burdensome.
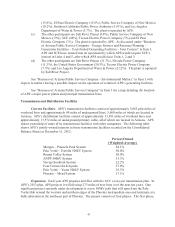
Customer and Sales Growth. For the three years 2010 through 2012, APS’s customer growth
averaged 0.7% per year. We currently expect annual customer growth to average about 2% for 2013
through 2015 based on our assessment of modestly improving economic conditions, both nationally
and in Arizona. For the three years 2010 through 2012, APS experienced annual declines in retail
electricity sales averaging 0.1%, adjusted to exclude the effects of weather variations. We currently
estimate that annual retail electricity sales in kilowatt-hours will remain about flat on average during
2013 through 2015, excluding the effects of weather variations. Actual customer and sales growth may
differ from our projections as a result of numerous factors, such as economic conditions, customer
growth and usage patterns, and the effects of energy efficiency and distributed energy programs and
requirements. If our customer growth rate does not continue to improve as projected, or if it declines,
or if the Arizona economy fails to improve, we may be unable to reach our estimated demand level and
sales projections, which could have a negative impact on our financial condition, results of operations
and cash flows.
The operation of power generation facilities and transmission systems involves risks that could
result in reduced output or unscheduled outages, which could materially affect APS’s results of
operations.
The operation of power generation, transmission and distribution facilities involves certain
risks, including the risk of breakdown or failure of equipment, fuel interruption, and performance
below expected levels of output or efficiency. Unscheduled outages, including extensions of scheduled
outages due to mechanical failures or other complications, occur from time to time and are an inherent
risk of APS’s business. Because our transmission facilities are interconnected with those of third
parties, the operation of our facilities could be adversely affected by unexpected or uncontrollable
events occurring on the larger transmission power grid, and the operation or failure of our facilities
could adversely affect the operations of others. If APS’s facilities operate below expectations,
especially during its peak seasons, it may lose revenue or incur additional expenses, including
increased purchased power expenses.