APS 2012 Annual Report Download - page 193
Download and view the complete annual report
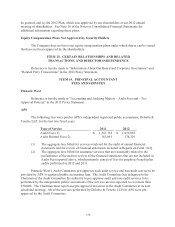
Please find page 193 of the 2012 APS annual report below. You can navigate through the pages in the report by either clicking on the pages listed below, or by using the keyword search tool below to find specific information within the annual report.-
 1
1 -
2
-
3
-
4
-
5
-
6
-
7
-
8
-
9
-
10
-
11
-
12
-
13
-
14
-
15
-
16
-
17
-
18
-
19
-
20
-
21
-
22
-
23
-
24
-
25
-
26
-
27
-
28
-
29
-
30
-
31
-
32
-
33
-
34
-
35
-
36
-
37
-
38
-
39
-
40
-
41
-
42
-
43
-
44
-
45
-
46
-
47
-
48
-
49
-
50
-
51
-
52
-
53
-
54
-
55
-
56
-
57
-
58
-
59
-
60
-
61
-
62
-
63
-
64
-
65
-
66
-
67
-
68
-
69
-
70
-
71
-
72
-
73
-
74
-
75
-
76
-
77
-
78
-
79
-
80
-
81
-
82
-
83
-
84
-
85
-
86
-
87
-
88
-
89
-
90
-
91
-
92
-
93
-
94
-
95
-
96
-
97
-
98
-
99
-
100
-
101
-
102
-
103
-
104
-
105
-
106
-
107
-
108
-
109
-
110
-
111
-
112
-
113
-
114
-
115
-
116
-
117
-
118
-
119
-
120
-
121
-
122
-
123
-
124
-
125
-
126
-
127
-
128
-
129
-
130
-
131
-
132
-
133
-
134
-
135
-
136
-
137
-
138
-
139
-
140
-
141
-
142
-
143
-
144
-
145
-
146
-
147
-
148
-
149
-
150
-
151
-
152
-
153
-
154
-
155
-
156
-
157
-
158
-
159
-
160
-
161
-
162
-
163
-
164
-
165
-
166
-
167
-
168
-
169
-
170
-
171
-
172
-
173
-
174
-
175
-
176
-
177
-
178
-
179
-
180
-
181
-
182
-
 183
183 -
 184
184 -
 185
185 -
 186
186 -
 187
187 -
 188
188 -
 189
189 -
 190
190 -
 191
191 -
 192
192 -
 193
193 -
 194
194 -
 195
195 -
 196
196 -
 197
197 -
 198
198 -
 199
199 -
 200
200 -
 201
201 -
 202
202 -
 203
203 -
204
-
205
-
206
-
207
-
208
-
209
-
210
-
211
-
212
-
213
-
214
-
215
-
216
-
217
-
218
-
219
-
220
-
221
-
222
-
223
-
224
-
225
-
226
-
227
-
228
-
229
-
230
-
231
-
232
-
233
-
234
-
235
-
236
-
237
-
238
-
239
-
240
-
241
-
242
-
243
-
244
-
245
-
246
-
247
-
248
-
249
-
250
-
251
-
252
-
253
-
254
-
255
-
256
 |
 |

ARIZONA PUBLIC SERVICE COMPANY
NOTES TO CONSOLIDATED FINANCIAL STATEMENTS
168
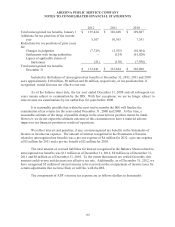
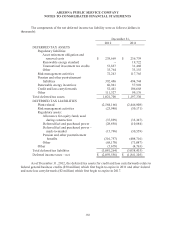
The components of the net deferred income tax liability were as follows (dollars in
thousands):
December 31,
2012
2011
DEFERRED TAX ASSETS
Regulatory liabilities:
Asset retirement obligation and
removal costs
$ 238,669
$ 236,739
Renewable energy standard
--
19,722
Unamortized investment tax credits
53,837
31,460
Other
33,764
33,155
Risk management activities
72,243
117,765
Pension and other postretirement
liabilities
392,486
494,744
Renewable energy incentives
66,941
57,901
Credit and loss carryforwards
52,441
106,668
Other
111,327
99,176
Total deferred tax assets
1,021,708
1,197,330
DEFERRED TAX LIABILITIES
Plant-related
(2,584,166)
(2,446,908)
Risk management activities
(23,940)
(30,171)
Regulatory assets:
Allowance for equity funds used
during construction
(37,899)
(33,347)
Deferred fuel and purchased power
(28,858)
(10,884)
Deferred fuel and purchased power –
mark-to-market
(15,796)
(30,559)
Pension and other postretirement
benefits
(316,757)
(408,716)
Other
(68,170)
(73,087)
Other
(5,678)
(4,763)
Total deferred tax liabilities
(3,081,264)
(3,038,435)
Deferred income taxes – net
$ (2,059,556)
$ (1,841,105)
As of December 31, 2012, the deferred tax assets for credit and loss carryforwards relate to
federal general business credits ($50 million) which first begin to expire in 2031 and other federal
and state loss carryforwards ($2 million) which first begin to expire in 2017.