APS 2012 Annual Report Download - page 144
Download and view the complete annual report
Please find page 144 of the 2012 APS annual report below. You can navigate through the pages in the report by either clicking on the pages listed below, or by using the keyword search tool below to find specific information within the annual report.-
 1
1 -
2
-
3
-
4
-
5
-
6
-
7
-
8
-
9
-
10
-
11
-
12
-
13
-
14
-
15
-
16
-
17
-
18
-
19
-
20
-
21
-
22
-
23
-
24
-
25
-
26
-
27
-
28
-
29
-
30
-
31
-
32
-
33
-
34
-
35
-
36
-
37
-
38
-
39
-
40
-
41
-
42
-
43
-
44
-
45
-
46
-
47
-
48
-
49
-
50
-
51
-
52
-
53
-
54
-
55
-
56
-
57
-
58
-
59
-
60
-
61
-
62
-
63
-
64
-
65
-
66
-
67
-
68
-
69
-
70
-
71
-
72
-
73
-
74
-
75
-
76
-
77
-
78
-
79
-
80
-
81
-
82
-
83
-
84
-
85
-
86
-
87
-
88
-
89
-
90
-
91
-
92
-
93
-
94
-
95
-
96
-
97
-
98
-
99
-
100
-
101
-
102
-
103
-
104
-
105
-
106
-
107
-
108
-
109
-
110
-
111
-
112
-
113
-
114
-
115
-
116
-
117
-
118
-
119
-
120
-
121
-
122
-
123
-
124
-
125
-
126
-
127
-
128
-
129
-
130
-
131
-
132
-
133
-
 134
134 -
 135
135 -
 136
136 -
 137
137 -
 138
138 -
 139
139 -
 140
140 -
 141
141 -
 142
142 -
 143
143 -
 144
144 -
 145
145 -
 146
146 -
 147
147 -
 148
148 -
 149
149 -
 150
150 -
 151
151 -
 152
152 -
 153
153 -
 154
154 -
155
-
156
-
157
-
158
-
159
-
160
-
161
-
162
-
163
-
164
-
165
-
166
-
167
-
168
-
169
-
170
-
171
-
172
-
173
-
174
-
175
-
176
-
177
-
178
-
179
-
180
-
181
-
182
-
183
-
184
-
185
-
186
-
187
-
188
-
189
-
190
-
191
-
192
-
193
-
194
-
195
-
196
-
197
-
198
-
199
-
200
-
201
-
202
-
203
-
204
-
205
-
206
-
207
-
208
-
209
-
210
-
211
-
212
-
213
-
214
-
215
-
216
-
217
-
218
-
219
-
220
-
221
-
222
-
223
-
224
-
225
-
226
-
227
-
228
-
229
-
230
-
231
-
232
-
233
-
234
-
235
-
236
-
237
-
238
-
239
-
240
-
241
-
242
-
243
-
244
-
245
-
246
-
247
-
248
-
249
-
250
-
251
-
252
-
253
-
254
-
255
-
256
 |
 |

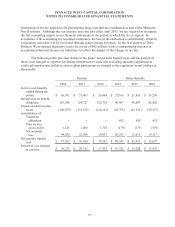
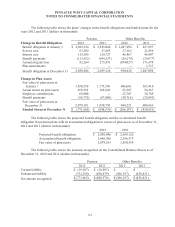
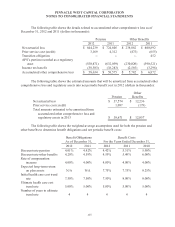
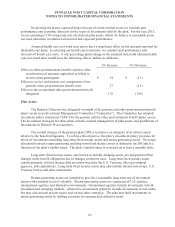
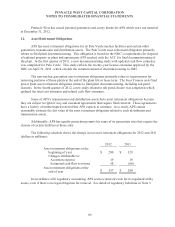
PINNACLE WEST CAPITAL CORPORATION
NOTES TO CONSOLIDATED FINANCIAL STATEMENTS
119
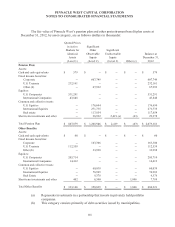
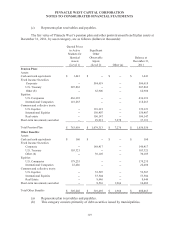
(c) Represents plan receivables and payables.
The fair value of Pinnacle West’s pension plan and other postretirement benefit plan assets at
December 31, 2011, by asset category, are as follows (dollars in thousands):
Quoted Prices
in Active
Markets for
Identical
Assets
(Level 1)
Significant
Other
Observable
Inputs
(Level 2)
Other (a)
Balance at
December 31,
2011
Pension Plan:
Assets:
Cash and cash equivalents
$ 1,441
$ --
$ --
$ 1,441
Fixed Income Securities:
Corporate
--
584,619
--
584,619
U.S. Treasury
207,862
--
--
207,862
Other (b)
--
62,906
--
62,906
Equities:
U.S. Companies
436,393
--
--
436,393
International Companies
118,263
--
--
118,263
Common and collective trusts:
U.S. Equities
--
139,321
--
139,321
International Equities
--
156,407
--
156,407
Real estate
--
106,147
--
106,147
Short-term investments and other
--
29,913
7,278
37,191
Total Pension Plan
$ 763,959
$ 1,079,313
$ 7,278
$ 1,850,550
Other Benefits:
Assets:
Cash and cash equivalents
$ 160
$ --
$ --
$ 160
Fixed Income Securities:
Corporate
--
148,417
--
148,417
U.S. Treasury
103,321
--
--
103,321
Other (b)
--
30,105
--
30,105
Equities:
U.S. Companies
179,235
--
--
179,235
International Companies
22,486
--
--
22,486
Common and collective trusts:
U.S. Equities
--
52,507
--
52,507
International Equities
--
53,504
--
53,504
Real Estate
--
8,446
--
8,446
Short-term investments and other -- 8,516 1,966 10,482
Total Other Benefits
$ 305,202 $ 301,495 $ 1,966 $ 608,663
(a) Represents plan receivables and payables.
(b) This category consists primarily of debt securities issued by municipalities.