APS 2012 Annual Report Download - page 136
Download and view the complete annual report
Please find page 136 of the 2012 APS annual report below. You can navigate through the pages in the report by either clicking on the pages listed below, or by using the keyword search tool below to find specific information within the annual report.-
 1
1 -
2
-
3
-
4
-
5
-
6
-
7
-
8
-
9
-
10
-
11
-
12
-
13
-
14
-
15
-
16
-
17
-
18
-
19
-
20
-
21
-
22
-
23
-
24
-
25
-
26
-
27
-
28
-
29
-
30
-
31
-
32
-
33
-
34
-
35
-
36
-
37
-
38
-
39
-
40
-
41
-
42
-
43
-
44
-
45
-
46
-
47
-
48
-
49
-
50
-
51
-
52
-
53
-
54
-
55
-
56
-
57
-
58
-
59
-
60
-
61
-
62
-
63
-
64
-
65
-
66
-
67
-
68
-
69
-
70
-
71
-
72
-
73
-
74
-
75
-
76
-
77
-
78
-
79
-
80
-
81
-
82
-
83
-
84
-
85
-
86
-
87
-
88
-
89
-
90
-
91
-
92
-
93
-
94
-
95
-
96
-
97
-
98
-
99
-
100
-
101
-
102
-
103
-
104
-
105
-
106
-
107
-
108
-
109
-
110
-
111
-
112
-
113
-
114
-
115
-
116
-
117
-
118
-
119
-
120
-
121
-
122
-
123
-
124
-
125
-
 126
126 -
 127
127 -
 128
128 -
 129
129 -
 130
130 -
 131
131 -
 132
132 -
 133
133 -
 134
134 -
 135
135 -
 136
136 -
 137
137 -
 138
138 -
 139
139 -
 140
140 -
 141
141 -
 142
142 -
 143
143 -
 144
144 -
 145
145 -
 146
146 -
147
-
148
-
149
-
150
-
151
-
152
-
153
-
154
-
155
-
156
-
157
-
158
-
159
-
160
-
161
-
162
-
163
-
164
-
165
-
166
-
167
-
168
-
169
-
170
-
171
-
172
-
173
-
174
-
175
-
176
-
177
-
178
-
179
-
180
-
181
-
182
-
183
-
184
-
185
-
186
-
187
-
188
-
189
-
190
-
191
-
192
-
193
-
194
-
195
-
196
-
197
-
198
-
199
-
200
-
201
-
202
-
203
-
204
-
205
-
206
-
207
-
208
-
209
-
210
-
211
-
212
-
213
-
214
-
215
-
216
-
217
-
218
-
219
-
220
-
221
-
222
-
223
-
224
-
225
-
226
-
227
-
228
-
229
-
230
-
231
-
232
-
233
-
234
-
235
-
236
-
237
-
238
-
239
-
240
-
241
-
242
-
243
-
244
-
245
-
246
-
247
-
248
-
249
-
250
-
251
-
252
-
253
-
254
-
255
-
256
 |
 |

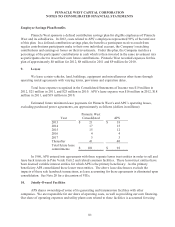
PINNACLE WEST CAPITAL CORPORATION
NOTES TO CONSOLIDATED FINANCIAL STATEMENTS
111
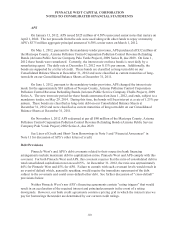
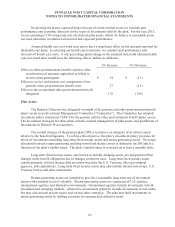
All of Pinnacle West’s loan agreements contain “cross-default” provisions that would result in
defaults and the potential acceleration of payment under these loan agreements if Pinnacle West or APS
were to default under certain other material agreements. All of APS’s bank agreements contain cross-
default provisions that would result in defaults and the potential acceleration of payment under these
bank agreements if APS were to default under certain other material agreements. Pinnacle West and
APS do not have a material adverse change restriction for credit facility borrowings.
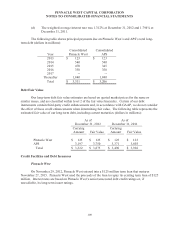
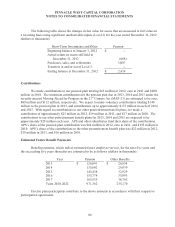
An existing ACC order requires APS to maintain a common equity ratio of at least 40%. As
defined in the ACC order, the common equity ratio is total shareholder equity divided by the sum of
total shareholder equity and long-term debt, including current maturities of long-term debt. At
December 31, 2012, APS was in compliance with this common equity ratio requirement. Its total
shareholder equity was approximately $4.1 billion, and total capitalization was approximately $7.2
billion. APS would be prohibited from paying dividends if the payment would reduce its total
shareholder equity below approximately $2.9 billion, assuming APS’s total capitalization remains the
same. Since APS was in compliance with this common equity ratio requirement, this restriction does
not materially affect Pinnacle West’s ability to meet its ongoing capital requirements.
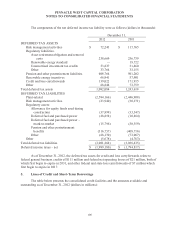
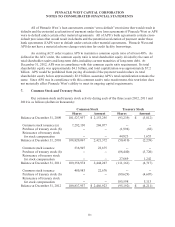
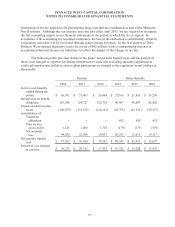
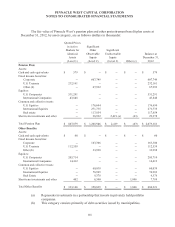
7. Common Stock and Treasury Stock
Our common stock and treasury stock activity during each of the three years 2012, 2011 and
2010 is as follows (dollars in thousands):
Common Stock
Treasury Stock
Shares
Amount
Shares
Amount
Balance at December 31, 2009
101,527,937
$ 2,153,295
(93,239)
$ (3,812)
Common stock issuance (a)
7,292,130
268,077
--
--
Purchase of treasury stock (b)
--
--
(1,994)
(82)
Reissuance of treasury stock
for stock compensation
--
--
44,823
1,655
Balance at December 31, 2010
108,820,067
2,421,372
(50,410)
(2,239)
Common stock issuance
536,907
22,875
--
--
Purchase of treasury stock (b)
--
--
(88,440)
(3,720)
Reissuance of treasury stock
for stock compensation
--
--
27,689
1,242
Balance at December 31, 2011
109,356,974
2,444,247
(111,161)
(4,717)
Common stock issuance
480,983
22,676
--
--
Purchase of treasury stock (b)
--
--
(89,629)
(4,607)
Reissuance of treasury stock
for stock compensation
-- -- 105,598 5,113
Balance at December 31, 2012
109,837,957
$ 2,466,923
(95,192)
$ (4,211)