APS 2012 Annual Report Download - page 35
Download and view the complete annual report
Please find page 35 of the 2012 APS annual report below. You can navigate through the pages in the report by either clicking on the pages listed below, or by using the keyword search tool below to find specific information within the annual report.-
 1
1 -
2
-
3
-
4
-
5
-
6
-
7
-
8
-
9
-
10
-
11
-
12
-
13
-
14
-
15
-
16
-
17
-
18
-
19
-
20
-
21
-
22
-
23
-
24
-
 25
25 -
 26
26 -
 27
27 -
 28
28 -
 29
29 -
 30
30 -
 31
31 -
 32
32 -
 33
33 -
 34
34 -
 35
35 -
 36
36 -
 37
37 -
 38
38 -
 39
39 -
 40
40 -
 41
41 -
 42
42 -
 43
43 -
 44
44 -
 45
45 -
46
-
47
-
48
-
49
-
50
-
51
-
52
-
53
-
54
-
55
-
56
-
57
-
58
-
59
-
60
-
61
-
62
-
63
-
64
-
65
-
66
-
67
-
68
-
69
-
70
-
71
-
72
-
73
-
74
-
75
-
76
-
77
-
78
-
79
-
80
-
81
-
82
-
83
-
84
-
85
-
86
-
87
-
88
-
89
-
90
-
91
-
92
-
93
-
94
-
95
-
96
-
97
-
98
-
99
-
100
-
101
-
102
-
103
-
104
-
105
-
106
-
107
-
108
-
109
-
110
-
111
-
112
-
113
-
114
-
115
-
116
-
117
-
118
-
119
-
120
-
121
-
122
-
123
-
124
-
125
-
126
-
127
-
128
-
129
-
130
-
131
-
132
-
133
-
134
-
135
-
136
-
137
-
138
-
139
-
140
-
141
-
142
-
143
-
144
-
145
-
146
-
147
-
148
-
149
-
150
-
151
-
152
-
153
-
154
-
155
-
156
-
157
-
158
-
159
-
160
-
161
-
162
-
163
-
164
-
165
-
166
-
167
-
168
-
169
-
170
-
171
-
172
-
173
-
174
-
175
-
176
-
177
-
178
-
179
-
180
-
181
-
182
-
183
-
184
-
185
-
186
-
187
-
188
-
189
-
190
-
191
-
192
-
193
-
194
-
195
-
196
-
197
-
198
-
199
-
200
-
201
-
202
-
203
-
204
-
205
-
206
-
207
-
208
-
209
-
210
-
211
-
212
-
213
-
214
-
215
-
216
-
217
-
218
-
219
-
220
-
221
-
222
-
223
-
224
-
225
-
226
-
227
-
228
-
229
-
230
-
231
-
232
-
233
-
234
-
235
-
236
-
237
-
238
-
239
-
240
-
241
-
242
-
243
-
244
-
245
-
246
-
247
-
248
-
249
-
250
-
251
-
252
-
253
-
254
-
255
-
256
 |
 |

11
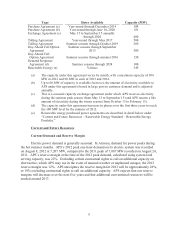
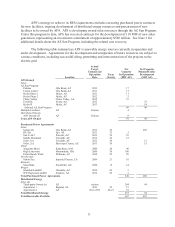
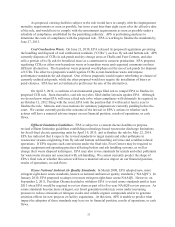
Type
Dates Available
Capacity (MW)
Purchase Agreement (a)
Year-round through December 2014
104
Purchase Agreement (b)
Year-round through June 14, 2020
60
Exchange Agreement (c)
May 15 to September 15 annually
through 2020
480
Tolling Agreement
Year-round through May 2017
500
Tolling Agreement
Summer seasons through October 2019
560
Day-Ahead Call Option
Agreement
Summer seasons through September
2015
500
Day-Ahead Call
Option Agreement
Summer seasons through summer 2016
150
Demand Response
Agreement (d)
Summer seasons through 2024
100
Renewable Energy (e)
Various
349
(a) The capacity under this agreement varies by month, with a maximum capacity of 104
MW in 2012 and 90 MW in each of 2013 and 2014.
(b) Up to 60 MW of capacity is available; however, the amount of electricity available to
APS under this agreement is based in large part on customer demand and is adjusted
annually.
(c) This is a seasonal capacity exchange agreement under which APS receives electricity
during the summer peak season (from May 15 to September 15) and APS returns a like
amount of electricity during the winter season (from October 15 to February 15).
(d) The capacity under this agreement increases in phases over the first three years to reach
the 100 MW level by the summer of 2012.
(e) Renewable energy purchased power agreements are described in detail below under
“Current and Future Resources – Renewable Energy Standard – Renewable Energy
Portfolio.”
Current and Future Resources
Current Demand and Reserve Margin
Electric power demand is generally seasonal. In Arizona, demand for power peaks during
the hot summer months. APS’s 2012 peak one-hour demand on its electric system was recorded
on August 8, 2012 at 7,207 MW, compared to the 2011 peak of 7,087 MW recorded on August 24,
2011. APS’s reserve margin at the time of the 2012 peak demand, calculated using system load
serving capacity, was 22%. Excluding certain contractual rights to call on additional capacity on
short notice, which APS may use in the event of unusual weather or unplanned outages, the 2012
reserve margin was 12%. APS anticipates the reserve margin for 2013 will be approximately 28%,
or 19% excluding contractual rights to call on additional capacity. APS expects that our reserve
margins will decrease over the next five years and that additional conventional resources will be
needed around 2017.