APS 2012 Annual Report Download - page 161
Download and view the complete annual report
Please find page 161 of the 2012 APS annual report below. You can navigate through the pages in the report by either clicking on the pages listed below, or by using the keyword search tool below to find specific information within the annual report.-
 1
1 -
2
-
3
-
4
-
5
-
6
-
7
-
8
-
9
-
10
-
11
-
12
-
13
-
14
-
15
-
16
-
17
-
18
-
19
-
20
-
21
-
22
-
23
-
24
-
25
-
26
-
27
-
28
-
29
-
30
-
31
-
32
-
33
-
34
-
35
-
36
-
37
-
38
-
39
-
40
-
41
-
42
-
43
-
44
-
45
-
46
-
47
-
48
-
49
-
50
-
51
-
52
-
53
-
54
-
55
-
56
-
57
-
58
-
59
-
60
-
61
-
62
-
63
-
64
-
65
-
66
-
67
-
68
-
69
-
70
-
71
-
72
-
73
-
74
-
75
-
76
-
77
-
78
-
79
-
80
-
81
-
82
-
83
-
84
-
85
-
86
-
87
-
88
-
89
-
90
-
91
-
92
-
93
-
94
-
95
-
96
-
97
-
98
-
99
-
100
-
101
-
102
-
103
-
104
-
105
-
106
-
107
-
108
-
109
-
110
-
111
-
112
-
113
-
114
-
115
-
116
-
117
-
118
-
119
-
120
-
121
-
122
-
123
-
124
-
125
-
126
-
127
-
128
-
129
-
130
-
131
-
132
-
133
-
134
-
135
-
136
-
137
-
138
-
139
-
140
-
141
-
142
-
143
-
144
-
145
-
146
-
147
-
148
-
149
-
150
-
 151
151 -
 152
152 -
 153
153 -
 154
154 -
 155
155 -
 156
156 -
 157
157 -
 158
158 -
 159
159 -
 160
160 -
 161
161 -
 162
162 -
 163
163 -
 164
164 -
 165
165 -
 166
166 -
 167
167 -
 168
168 -
 169
169 -
 170
170 -
 171
171 -
172
-
173
-
174
-
175
-
176
-
177
-
178
-
179
-
180
-
181
-
182
-
183
-
184
-
185
-
186
-
187
-
188
-
189
-
190
-
191
-
192
-
193
-
194
-
195
-
196
-
197
-
198
-
199
-
200
-
201
-
202
-
203
-
204
-
205
-
206
-
207
-
208
-
209
-
210
-
211
-
212
-
213
-
214
-
215
-
216
-
217
-
218
-
219
-
220
-
221
-
222
-
223
-
224
-
225
-
226
-
227
-
228
-
229
-
230
-
231
-
232
-
233
-
234
-
235
-
236
-
237
-
238
-
239
-
240
-
241
-
242
-
243
-
244
-
245
-
246
-
247
-
248
-
249
-
250
-
251
-
252
-
253
-
254
-
255
-
256
 |
 |

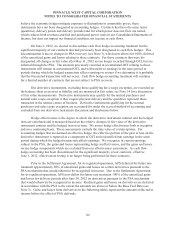
PINNACLE WEST CAPITAL CORPORATION
NOTES TO CONSOLIDATED FINANCIAL STATEMENTS
136
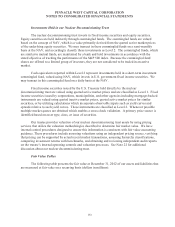
Because our forward commodity contracts classified as Level 3 are currently in a net purchase
position, we would expect price increases of the underlying commodity to result in increases in the net
fair value of the related contracts. Conversely, if the price of the underlying commodity decreases, the
net fair value of the related contracts would likely decrease.
Our option contracts classified as Level 3 primarily relate to purchase heat rate options. The
significant unobservable inputs for these instruments include electricity prices, gas prices and implied
volatilities. If electricity prices and electricity price implied volatilities increase we would expect the
fair value of these options to increase, and if these valuation inputs decrease we would expect the fair
value of these options to decrease. If natural gas prices and natural gas price implied volatilities
increase we would expect the fair value of these options to decrease, and if these inputs decrease we
would expect the fair value of the options to increase. The commodity prices and implied volatilities do
not always move in corresponding directions. The options’ fair values are impacted by the net changes
of these various inputs.
Other unobservable valuation inputs include credit and liquidity reserves which do not have a
material impact on our valuations; however, significant changes in these inputs could also result in
higher or lower fair value measurements.
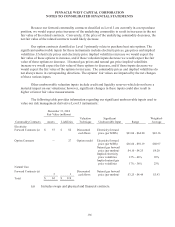
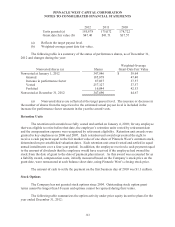
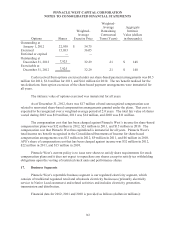
The following table provides information regarding our significant unobservable inputs used to
value our risk management derivative Level 3 instruments:
December 31, 2012
Fair Value (millions)
Commodity Contracts
Assets
Liabilities
Valuation
Technique
Significant
Unobservable Input
Range
Weighted-
Average
Electricity:
Forward Contracts (a)
$ 57
$ 82
Discounted
cash flows
Electricity forward
price (per MWh)
$23.06 - $64.20
$43.16
Option Contracts
--
27
Option model
Electricity forward
price (per MWh)
$36.66 - $92.19
$60.97
Natural gas forward
price (per mmbtu)
$4.10 - $4.25
$4.20
Implied electricity
price volatilities
15% - 66%
39%
Implied natural gas
price volatilities
17% - 36%
23%
Natural Gas:
Forward Contracts (a)
5
1
Discounted
cash flows
Natural gas forward
price (per mmbtu)
$3.25 - $4.44
$3.93
Total $ 62 $ 110
(a) Includes swaps and physical and financial contracts.