APS 2012 Annual Report Download - page 106
Download and view the complete annual report
Please find page 106 of the 2012 APS annual report below. You can navigate through the pages in the report by either clicking on the pages listed below, or by using the keyword search tool below to find specific information within the annual report.-
 1
1 -
2
-
3
-
4
-
5
-
6
-
7
-
8
-
9
-
10
-
11
-
12
-
13
-
14
-
15
-
16
-
17
-
18
-
19
-
20
-
21
-
22
-
23
-
24
-
25
-
26
-
27
-
28
-
29
-
30
-
31
-
32
-
33
-
34
-
35
-
36
-
37
-
38
-
39
-
40
-
41
-
42
-
43
-
44
-
45
-
46
-
47
-
48
-
49
-
50
-
51
-
52
-
53
-
54
-
55
-
56
-
57
-
58
-
59
-
60
-
61
-
62
-
63
-
64
-
65
-
66
-
67
-
68
-
69
-
70
-
71
-
72
-
73
-
74
-
75
-
76
-
77
-
78
-
79
-
80
-
81
-
82
-
83
-
84
-
85
-
86
-
87
-
88
-
89
-
90
-
91
-
92
-
93
-
94
-
95
-
 96
96 -
 97
97 -
 98
98 -
 99
99 -
 100
100 -
 101
101 -
 102
102 -
 103
103 -
 104
104 -
 105
105 -
 106
106 -
 107
107 -
 108
108 -
 109
109 -
 110
110 -
 111
111 -
 112
112 -
 113
113 -
 114
114 -
 115
115 -
 116
116 -
117
-
118
-
119
-
120
-
121
-
122
-
123
-
124
-
125
-
126
-
127
-
128
-
129
-
130
-
131
-
132
-
133
-
134
-
135
-
136
-
137
-
138
-
139
-
140
-
141
-
142
-
143
-
144
-
145
-
146
-
147
-
148
-
149
-
150
-
151
-
152
-
153
-
154
-
155
-
156
-
157
-
158
-
159
-
160
-
161
-
162
-
163
-
164
-
165
-
166
-
167
-
168
-
169
-
170
-
171
-
172
-
173
-
174
-
175
-
176
-
177
-
178
-
179
-
180
-
181
-
182
-
183
-
184
-
185
-
186
-
187
-
188
-
189
-
190
-
191
-
192
-
193
-
194
-
195
-
196
-
197
-
198
-
199
-
200
-
201
-
202
-
203
-
204
-
205
-
206
-
207
-
208
-
209
-
210
-
211
-
212
-
213
-
214
-
215
-
216
-
217
-
218
-
219
-
220
-
221
-
222
-
223
-
224
-
225
-
226
-
227
-
228
-
229
-
230
-
231
-
232
-
233
-
234
-
235
-
236
-
237
-
238
-
239
-
240
-
241
-
242
-
243
-
244
-
245
-
246
-
247
-
248
-
249
-
250
-
251
-
252
-
253
-
254
-
255
-
256
 |
 |

81
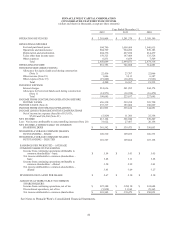
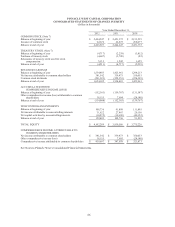
PINNACLE WEST CAPITAL CORPORATION
CONSOLIDATED STATEMENTS OF INCOME
(dollars and shares in thousands, except per share amounts)
Year Ended December 31,
2012
2011
2010
OPERATING REVENUES
$ 3,301,804
$ 3,241,379
$ 3,189,199
OPERATING EXPENSES
Fuel and purchased power
994,790
1,009,464
1,046,815
Operations and maintenance
884,769
904,286
870,185
Depreciation and amortization
404,336
427,054
414,479
Taxes other than income taxes
159,323
147,408
135,328
Other expenses
6,831
6,659
7,509
Total
2,450,049
2,494,871
2,474,316
OPERATING INCOME
851,755
746,508
714,883
OTHER INCOME (DEDUCTIONS)
Allowance for equity funds used during construction
(Note 1)
22,436
23,707
22,066
Other income (Note 19)
1,606
3,111
6,387
Other expense (Note 19)
(19,842)
(10,451)
(9,921)
Total
4,200
16,367
18,532
INTEREST EXPENSE
Interest charges
214,616
241,995
244,174
Allowance for borrowed funds used during construction
(Note 1)
(14,971) (18,358) (16,479)
Total
199,645
223,637
227,695
INCOME FROM CONTINUING OPERATIONS BEFORE
INCOME TAXES
656,310
539,238
505,720
INCOME TAXES (Note 4)
237,317
183,604
160,869
INCOME FROM CONTINUING OPERATIONS
418,993
355,634
344,851
INCOME (LOSS) FROM DISCONTINUED OPERATIONS
Net of income tax expense (benefit) of $(3,813),
$7,418 and $16,260 (Note 21)
(5,829)
11,306
25,358
NET INCOME
413,164
366,940
370,209
Less: Net income attributable to noncontrolling interests (Note 20)
31,622
27,467
20,156
NET INCOME ATTRIBUTABLE TO COMMON
SHAREHOLDERS
$ 381,542
$ 339,473
$ 350,053
WEIGHTED-AVERAGE COMMON SHARES
OUTSTANDING – BASIC
109,510
109,053
106,573
WEIGHTED-AVERAGE COMMON SHARES
OUTSTANDING – DILUTED
110,527
109,864
107,138
EARNINGS PER WEIGHTED – AVERAGE
COMMON SHARE OUTSTANDING
Income from continuing operations attributable to
common shareholders – basic
$ 3.54
$ 3.01
$ 3.05
Net income attributable to common shareholders –
basic
3.48
3.11
3.28
Income from continuing operations attributable to
common shareholders – diluted
3.50
2.99
3.03
Net income attributable to common shareholders –
diluted
3.45
3.09
3.27
DIVIDENDS DECLARED PER SHARE
$ 2.67
$ 2.10
$ 2.10
AMOUNTS ATTRIBUTABLE TO COMMON
SHAREHOLDERS:
Income from continuing operations, net of tax
$ 387,380
$ 328,110
$ 324,688
Discontinued operations, net of tax
(5,838)
11,363
25,365
Net income attributable to common shareholders
$ 381,542
$ 339,473
$ 350,053
See Notes to Pinnacle West’s Consolidated Financial Statements.