APS 2012 Annual Report Download - page 85
Download and view the complete annual report
Please find page 85 of the 2012 APS annual report below. You can navigate through the pages in the report by either clicking on the pages listed below, or by using the keyword search tool below to find specific information within the annual report.-
 1
1 -
2
-
3
-
4
-
5
-
6
-
7
-
8
-
9
-
10
-
11
-
12
-
13
-
14
-
15
-
16
-
17
-
18
-
19
-
20
-
21
-
22
-
23
-
24
-
25
-
26
-
27
-
28
-
29
-
30
-
31
-
32
-
33
-
34
-
35
-
36
-
37
-
38
-
39
-
40
-
41
-
42
-
43
-
44
-
45
-
46
-
47
-
48
-
49
-
50
-
51
-
52
-
53
-
54
-
55
-
56
-
57
-
58
-
59
-
60
-
61
-
62
-
63
-
64
-
65
-
66
-
67
-
68
-
69
-
70
-
71
-
72
-
73
-
74
-
 75
75 -
 76
76 -
 77
77 -
 78
78 -
 79
79 -
 80
80 -
 81
81 -
 82
82 -
 83
83 -
 84
84 -
 85
85 -
 86
86 -
 87
87 -
 88
88 -
 89
89 -
 90
90 -
 91
91 -
 92
92 -
 93
93 -
 94
94 -
 95
95 -
96
-
97
-
98
-
99
-
100
-
101
-
102
-
103
-
104
-
105
-
106
-
107
-
108
-
109
-
110
-
111
-
112
-
113
-
114
-
115
-
116
-
117
-
118
-
119
-
120
-
121
-
122
-
123
-
124
-
125
-
126
-
127
-
128
-
129
-
130
-
131
-
132
-
133
-
134
-
135
-
136
-
137
-
138
-
139
-
140
-
141
-
142
-
143
-
144
-
145
-
146
-
147
-
148
-
149
-
150
-
151
-
152
-
153
-
154
-
155
-
156
-
157
-
158
-
159
-
160
-
161
-
162
-
163
-
164
-
165
-
166
-
167
-
168
-
169
-
170
-
171
-
172
-
173
-
174
-
175
-
176
-
177
-
178
-
179
-
180
-
181
-
182
-
183
-
184
-
185
-
186
-
187
-
188
-
189
-
190
-
191
-
192
-
193
-
194
-
195
-
196
-
197
-
198
-
199
-
200
-
201
-
202
-
203
-
204
-
205
-
206
-
207
-
208
-
209
-
210
-
211
-
212
-
213
-
214
-
215
-
216
-
217
-
218
-
219
-
220
-
221
-
222
-
223
-
224
-
225
-
226
-
227
-
228
-
229
-
230
-
231
-
232
-
233
-
234
-
235
-
236
-
237
-
238
-
239
-
240
-
241
-
242
-
243
-
244
-
245
-
246
-
247
-
248
-
249
-
250
-
251
-
252
-
253
-
254
-
255
-
256
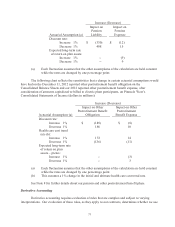
 |
 |

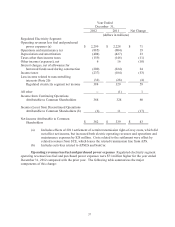
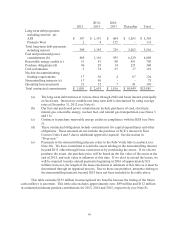
61
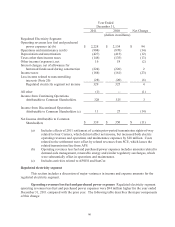
Increase (Decrease)
Operating
revenues
Fuel and
purchased
power
expenses
Net change
(dollars in millions)
Higher demand-side management, renewable
energy and similar regulatory surcharges
$ 29
$ 1
$ 28
Settlement of certain prior-period transmission
rights-of-way
28
--
28
Effects of weather on usage per customer
33
13
20
Higher retail transmission charges
10
--
10
Higher line extension revenues (Note 3)
7
--
7
Higher usage per customer
8
6
2
Refund of PSA deferrals
(33)
(40)
7
Higher fuel and purchased power costs, net of
off-system sales
(27)
(24)
(3)
Miscellaneous items, net
2
7
(5)
Total
$ 57
$ (37)
$ 94
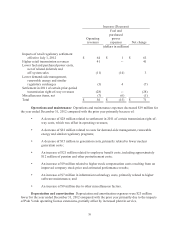
Operations and maintenance Operations and maintenance expenses increased $34 million for
the year ended December 31, 2011 compared with the prior year primarily because of:
• An increase of $28 million related to settlement in 2011 of certain transmission rights-
of-way costs, which was offset in operating revenues;
• An increase of $27 million related to costs for demand-side management, renewable
energy, and similar regulatory programs, which were offset in operating revenues;
• A decrease of $16 million related to employee benefit costs; and
• A decrease of $5 million due to other miscellaneous factors.
Depreciation and amortization Depreciation and amortization expenses were $12 million
higher for the year ended December 31, 2011 compared with the prior year primarily because of
increased plant in service.
Taxes other than income taxes Taxes other than income taxes increased $13 million for the
year ended December 31, 2011 compared with the prior year primarily because of higher property tax
rates in the current period.
Income taxes Income taxes were $23 million higher for the year ended December 31, 2011
compared with the prior year. This increase was primarily due to the effects of higher pretax income in
the current year and income tax benefits recognized in the prior year related to a reduction in the
Company’s 2010 effective income tax rate.