APS 2012 Annual Report Download - page 138
Download and view the complete annual report
Please find page 138 of the 2012 APS annual report below. You can navigate through the pages in the report by either clicking on the pages listed below, or by using the keyword search tool below to find specific information within the annual report.-
 1
1 -
2
-
3
-
4
-
5
-
6
-
7
-
8
-
9
-
10
-
11
-
12
-
13
-
14
-
15
-
16
-
17
-
18
-
19
-
20
-
21
-
22
-
23
-
24
-
25
-
26
-
27
-
28
-
29
-
30
-
31
-
32
-
33
-
34
-
35
-
36
-
37
-
38
-
39
-
40
-
41
-
42
-
43
-
44
-
45
-
46
-
47
-
48
-
49
-
50
-
51
-
52
-
53
-
54
-
55
-
56
-
57
-
58
-
59
-
60
-
61
-
62
-
63
-
64
-
65
-
66
-
67
-
68
-
69
-
70
-
71
-
72
-
73
-
74
-
75
-
76
-
77
-
78
-
79
-
80
-
81
-
82
-
83
-
84
-
85
-
86
-
87
-
88
-
89
-
90
-
91
-
92
-
93
-
94
-
95
-
96
-
97
-
98
-
99
-
100
-
101
-
102
-
103
-
104
-
105
-
106
-
107
-
108
-
109
-
110
-
111
-
112
-
113
-
114
-
115
-
116
-
117
-
118
-
119
-
120
-
121
-
122
-
123
-
124
-
125
-
126
-
127
-
 128
128 -
 129
129 -
 130
130 -
 131
131 -
 132
132 -
 133
133 -
 134
134 -
 135
135 -
 136
136 -
 137
137 -
 138
138 -
 139
139 -
 140
140 -
 141
141 -
 142
142 -
 143
143 -
 144
144 -
 145
145 -
 146
146 -
 147
147 -
 148
148 -
149
-
150
-
151
-
152
-
153
-
154
-
155
-
156
-
157
-
158
-
159
-
160
-
161
-
162
-
163
-
164
-
165
-
166
-
167
-
168
-
169
-
170
-
171
-
172
-
173
-
174
-
175
-
176
-
177
-
178
-
179
-
180
-
181
-
182
-
183
-
184
-
185
-
186
-
187
-
188
-
189
-
190
-
191
-
192
-
193
-
194
-
195
-
196
-
197
-
198
-
199
-
200
-
201
-
202
-
203
-
204
-
205
-
206
-
207
-
208
-
209
-
210
-
211
-
212
-
213
-
214
-
215
-
216
-
217
-
218
-
219
-
220
-
221
-
222
-
223
-
224
-
225
-
226
-
227
-
228
-
229
-
230
-
231
-
232
-
233
-
234
-
235
-
236
-
237
-
238
-
239
-
240
-
241
-
242
-
243
-
244
-
245
-
246
-
247
-
248
-
249
-
250
-
251
-
252
-
253
-
254
-
255
-
256
 |
 |

PINNACLE WEST CAPITAL CORPORATION
NOTES TO CONSOLIDATED FINANCIAL STATEMENTS
113
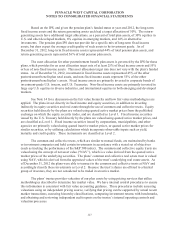
elimination of the tax deduction for prescription drug costs that are reimbursed as part of the Medicare
Part D subsidy. Although this tax increase does not take effect until 2013, we are required to recognize
the full accounting impact in our financial statements in the period in which the Act is signed. In
accordance with accounting for regulated companies, the loss of this deduction is substantially offset by
a regulatory asset that will be recovered through future electric revenues. In the first quarter of 2010,
Pinnacle West charged regulatory assets for a total of $42 million, with a corresponding increase in
accumulated deferred income tax liabilities, to reflect the impact of this change in tax law.
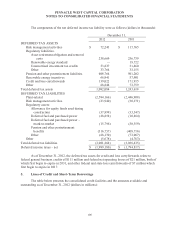
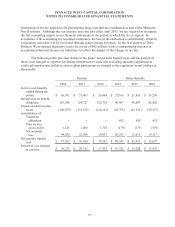
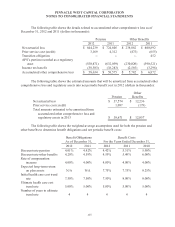
The following table provides details of the plans’ net periodic benefit costs and the portion of
these costs charged to expense (including administrative costs and excluding amounts capitalized as
overhead construction, billed to electric plant participants or charged to the regulatory asset) (dollars in
thousands):
Pension Other Benefits
2012 2011 2010 2012 2011 2010
Service cost-benefits
earned during the
period
$ 63,502
$ 57,605
$ 59,064
$ 27,163
$ 21,856
$ 19,236
Interest cost on benefit
obligation
119,586
124,727
122,724
46,467
46,807
42,428
Expected return on plan
assets
(140,979)
(133,678)
(124,161)
(45,793)
(41,536)
(39,257)
Amortization of:
Transition
obligation
--
--
--
452
452
452
Prior service
cost (credit)
1,143
1,400
1,705
(179)
(179)
(539)
Net actuarial
loss
44,250 25,956 18,833 20,233 15,015 10,317
Net periodic benefit
cost
$ 87,502 $ 76,010 $ 78,165 $ 48,343 $ 42,415 $ 32,637
Portion of cost charged
to expense
$ 36,333 $ 29,312 $ 37,933 $ 19,321 $ 15,208 $ 15,839