APS 2012 Annual Report Download - page 64
Download and view the complete annual report
Please find page 64 of the 2012 APS annual report below. You can navigate through the pages in the report by either clicking on the pages listed below, or by using the keyword search tool below to find specific information within the annual report.-
 1
1 -
 2
2 -
 3
3 -
 4
4 -
 5
5 -
 6
6 -
 7
7 -
 8
8 -
 9
9 -
 10
10 -
 11
11 -
 12
12 -
 13
13 -
 14
14 -
 15
15 -
 16
16 -
 17
17 -
 18
18 -
 19
19 -
 20
20 -
 21
21 -
 22
22 -
 23
23 -
 24
24 -
 25
25 -
 26
26 -
 27
27 -
 28
28 -
 29
29 -
 30
30 -
 31
31 -
 32
32 -
 33
33 -
 34
34 -
 35
35 -
 36
36 -
 37
37 -
 38
38 -
 39
39 -
 40
40 -
 41
41 -
 42
42 -
 43
43 -
 44
44 -
 45
45 -
 46
46 -
 47
47 -
 48
48 -
 49
49 -
 50
50 -
 51
51 -
 52
52 -
 53
53 -
 54
54 -
 55
55 -
 56
56 -
 57
57 -
 58
58 -
 59
59 -
 60
60 -
 61
61 -
 62
62 -
 63
63 -
 64
64 -
 65
65 -
 66
66 -
 67
67 -
 68
68 -
 69
69 -
 70
70 -
 71
71 -
 72
72 -
 73
73 -
 74
74 -
 75
75 -
 76
76 -
 77
77 -
 78
78 -
 79
79 -
 80
80 -
 81
81 -
 82
82 -
 83
83 -
 84
84 -
 85
85 -
 86
86 -
 87
87 -
 88
88 -
 89
89 -
 90
90 -
 91
91 -
 92
92 -
 93
93 -
 94
94 -
 95
95 -
 96
96 -
 97
97 -
 98
98 -
 99
99 -
 100
100 -
 101
101 -
 102
102 -
 103
103 -
 104
104 -
 105
105 -
 106
106 -
 107
107 -
 108
108 -
 109
109 -
 110
110 -
 111
111 -
 112
112 -
 113
113 -
 114
114 -
 115
115 -
 116
116 -
 117
117 -
 118
118 -
 119
119 -
 120
120 -
 121
121 -
 122
122 -
 123
123 -
 124
124 -
 125
125 -
 126
126 -
 127
127 -
 128
128 -
 129
129 -
 130
130 -
 131
131 -
 132
132 -
 133
133 -
 134
134 -
 135
135 -
 136
136 -
 137
137 -
 138
138 -
 139
139 -
 140
140 -
 141
141 -
 142
142 -
 143
143 -
 144
144 -
 145
145 -
 146
146 -
 147
147 -
 148
148 -
 149
149 -
 150
150 -
 151
151 -
 152
152 -
 153
153 -
 154
154 -
 155
155 -
 156
156 -
 157
157 -
 158
158 -
 159
159 -
 160
160 -
 161
161 -
 162
162 -
 163
163 -
 164
164 -
 165
165 -
 166
166 -
 167
167 -
 168
168 -
 169
169 -
 170
170 -
 171
171 -
 172
172 -
 173
173 -
 174
174 -
 175
175 -
 176
176 -
 177
177 -
 178
178 -
 179
179 -
 180
180 -
 181
181 -
 182
182 -
 183
183 -
 184
184 -
 185
185 -
 186
186 -
 187
187 -
 188
188 -
 189
189 -
 190
190 -
 191
191 -
 192
192 -
 193
193 -
 194
194 -
 195
195 -
 196
196 -
 197
197 -
 198
198 -
 199
199 -
 200
200 -
 201
201 -
 202
202 -
 203
203 -
 204
204 -
 205
205 -
 206
206 -
 207
207 -
 208
208 -
 209
209 -
 210
210 -
 211
211 -
 212
212 -
 213
213 -
 214
214 -
 215
215 -
 216
216 -
 217
217 -
 218
218 -
 219
219 -
 220
220 -
 221
221 -
 222
222 -
 223
223 -
 224
224 -
 225
225 -
 226
226 -
 227
227 -
 228
228 -
 229
229 -
 230
230 -
 231
231 -
 232
232 -
 233
233 -
 234
234 -
 235
235 -
 236
236 -
 237
237 -
 238
238 -
 239
239 -
 240
240 -
 241
241 -
 242
242 -
 243
243 -
 244
244 -
 245
245 -
 246
246 -
 247
247 -
 248
248 -
 249
249 -
 250
250 -
 251
251 -
 252
252 -
 253
253 -
 254
254 -
 255
255 -
 256
256
 |
 |

40
ITEM 2. PROPERTIES
Generation Facilities
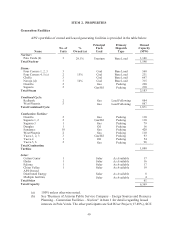
APS’s portfolio of owned and leased generating facilities is provided in the table below:
Name
No. of
Units
%
Owned (a)
Principal
Fuels
Used
Primary
Dispatch
Type
Owned
Capacity
(MW)
Nuclear:
Palo Verde (b)
3
29.1%
Uranium
Base Load
1,146
Total Nuclear
1,146
Steam:
Four Corners 1, 2, 3
3
Coal
Base Load
560
Four Corners 4, 5 (c)
2
15%
Coal
Base Load
231
Cholla
3
Coal
Base Load
647
Navajo (d)
3
14%
Coal
Base Load
315
Ocotillo
2
Gas
Peaking
220
Saguaro
2
Gas/Oil
Peaking
210
Total Steam
2,183
Combined Cycle:
Redhawk
2
Gas
Load Following
984
West Phoenix
5
Gas
Load Following
887
Total Combined Cycle
1,871
Combustion Turbine:
Ocotillo
2
Gas
Peaking
110
Saguaro 1, 2
2
Gas/Oil
Peaking
110
Saguaro 3
1
Gas
Peaking
79
Douglas
1
Oil
Peaking
16
Sundance
10
Gas
Peaking
420
West Phoenix
2
Gas
Peaking
110
Yucca 1, 2, 3
3
Gas/Oil
Peaking
93
Yucca 4
1
Oil
Peaking
54
Yucca 5, 6
2
Gas
Peaking
96
Total Combustion
Turbine
1,088
Solar:
Cotton Center
1
Solar
As Available
17
Hyder
1
Solar
As Available
16
Paloma
1
Solar
As Available
17
Chino Valley
1
Solar
As Available
19
APS Owned
Distributed Energy
Solar
As Available
8
Multiple facilities
Solar
As Available
4
Total Solar
81
Total Capacity
6,369
(a) 100% unless otherwise noted.
(b) See “Business of Arizona Public Service Company – Energy Sources and Resource
Planning – Generation Facilities – Nuclear” in Item 1 for details regarding leased
interests in Palo Verde. The other participants are Salt River Project (17.49%), SCE
