APS 2012 Annual Report Download - page 19
Download and view the complete annual report
Please find page 19 of the 2012 APS annual report below. You can navigate through the pages in the report by either clicking on the pages listed below, or by using the keyword search tool below to find specific information within the annual report.-
 1
1 -
2
-
3
-
4
-
5
-
6
-
7
-
8
-
 9
9 -
 10
10 -
 11
11 -
 12
12 -
 13
13 -
 14
14 -
 15
15 -
 16
16 -
 17
17 -
 18
18 -
 19
19 -
 20
20 -
 21
21 -
 22
22 -
 23
23 -
 24
24 -
 25
25 -
 26
26 -
 27
27 -
 28
28 -
 29
29 -
30
-
31
-
32
-
33
-
34
-
35
-
36
-
37
-
38
-
39
-
40
-
41
-
42
-
43
-
44
-
45
-
46
-
47
-
48
-
49
-
50
-
51
-
52
-
53
-
54
-
55
-
56
-
57
-
58
-
59
-
60
-
61
-
62
-
63
-
64
-
65
-
66
-
67
-
68
-
69
-
70
-
71
-
72
-
73
-
74
-
75
-
76
-
77
-
78
-
79
-
80
-
81
-
82
-
83
-
84
-
85
-
86
-
87
-
88
-
89
-
90
-
91
-
92
-
93
-
94
-
95
-
96
-
97
-
98
-
99
-
100
-
101
-
102
-
103
-
104
-
105
-
106
-
107
-
108
-
109
-
110
-
111
-
112
-
113
-
114
-
115
-
116
-
117
-
118
-
119
-
120
-
121
-
122
-
123
-
124
-
125
-
126
-
127
-
128
-
129
-
130
-
131
-
132
-
133
-
134
-
135
-
136
-
137
-
138
-
139
-
140
-
141
-
142
-
143
-
144
-
145
-
146
-
147
-
148
-
149
-
150
-
151
-
152
-
153
-
154
-
155
-
156
-
157
-
158
-
159
-
160
-
161
-
162
-
163
-
164
-
165
-
166
-
167
-
168
-
169
-
170
-
171
-
172
-
173
-
174
-
175
-
176
-
177
-
178
-
179
-
180
-
181
-
182
-
183
-
184
-
185
-
186
-
187
-
188
-
189
-
190
-
191
-
192
-
193
-
194
-
195
-
196
-
197
-
198
-
199
-
200
-
201
-
202
-
203
-
204
-
205
-
206
-
207
-
208
-
209
-
210
-
211
-
212
-
213
-
214
-
215
-
216
-
217
-
218
-
219
-
220
-
221
-
222
-
223
-
224
-
225
-
226
-
227
-
228
-
229
-
230
-
231
-
232
-
233
-
234
-
235
-
236
-
237
-
238
-
239
-
240
-
241
-
242
-
243
-
244
-
245
-
246
-
247
-
248
-
249
-
250
-
251
-
252
-
253
-
254
-
255
-
256
 |
 |
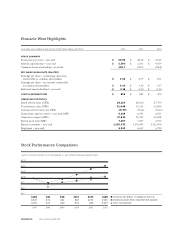
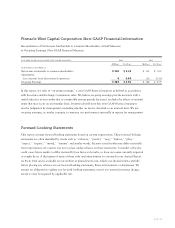
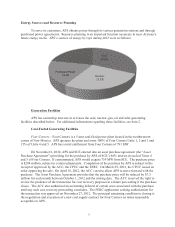
Pinnacle West Highlights
MOMENTUM 2012 ANNUAL REPORT
$175
$150
$125
$100
$75
$50
$25
(DOLLARS AND SHARES IN MILLIONS, EXCEPT PER SHARE AMOUNTS) 2012 2011 2010
STOCK SUMMARY
Stock price per share – year-end $ 50.98 $ 48.18 $ 41.45
Market capitalization – year-end $ 5,595 $ 5,263 $ 4,509
Common shares outstanding – year-end 109.7 109.2 108.8
PER SHARE HIGHLIGHTS (DILUTED)
Earnings per share – continuing operations
attributable to common shareholders $ 3.50 $ 2.99 $ 3.03
Earnings per share – net income attributable
to common shareholders $ 3.45 $ 3.09 $ 3.27
Indicated annual dividend – year-end $ 2.18 $ 2.10 $ 2.10
CAPITAL EXPENDITURES $ 836 $ 885 $ 670
OPERATING STATISTICS
Retail electric sales (GWh) 28,154 28,210 27,709
Total electric sales (GWh) 32,448 31,655 31,860
Average retail revenue (per kWh) 10.87 ¢ 10.61 ¢ 10.63 ¢
Generating capacity owned – year-end (MW) 6,369 6,343 6,293
Generation output (GWh) 27,635 27,055 26,828
System peak load (MW) 7,207 7,087 6,936
Electric customers – year-end 1,145,232 1,130,443 1,121,990
Employees – year-end 6,613 6,663 6,740
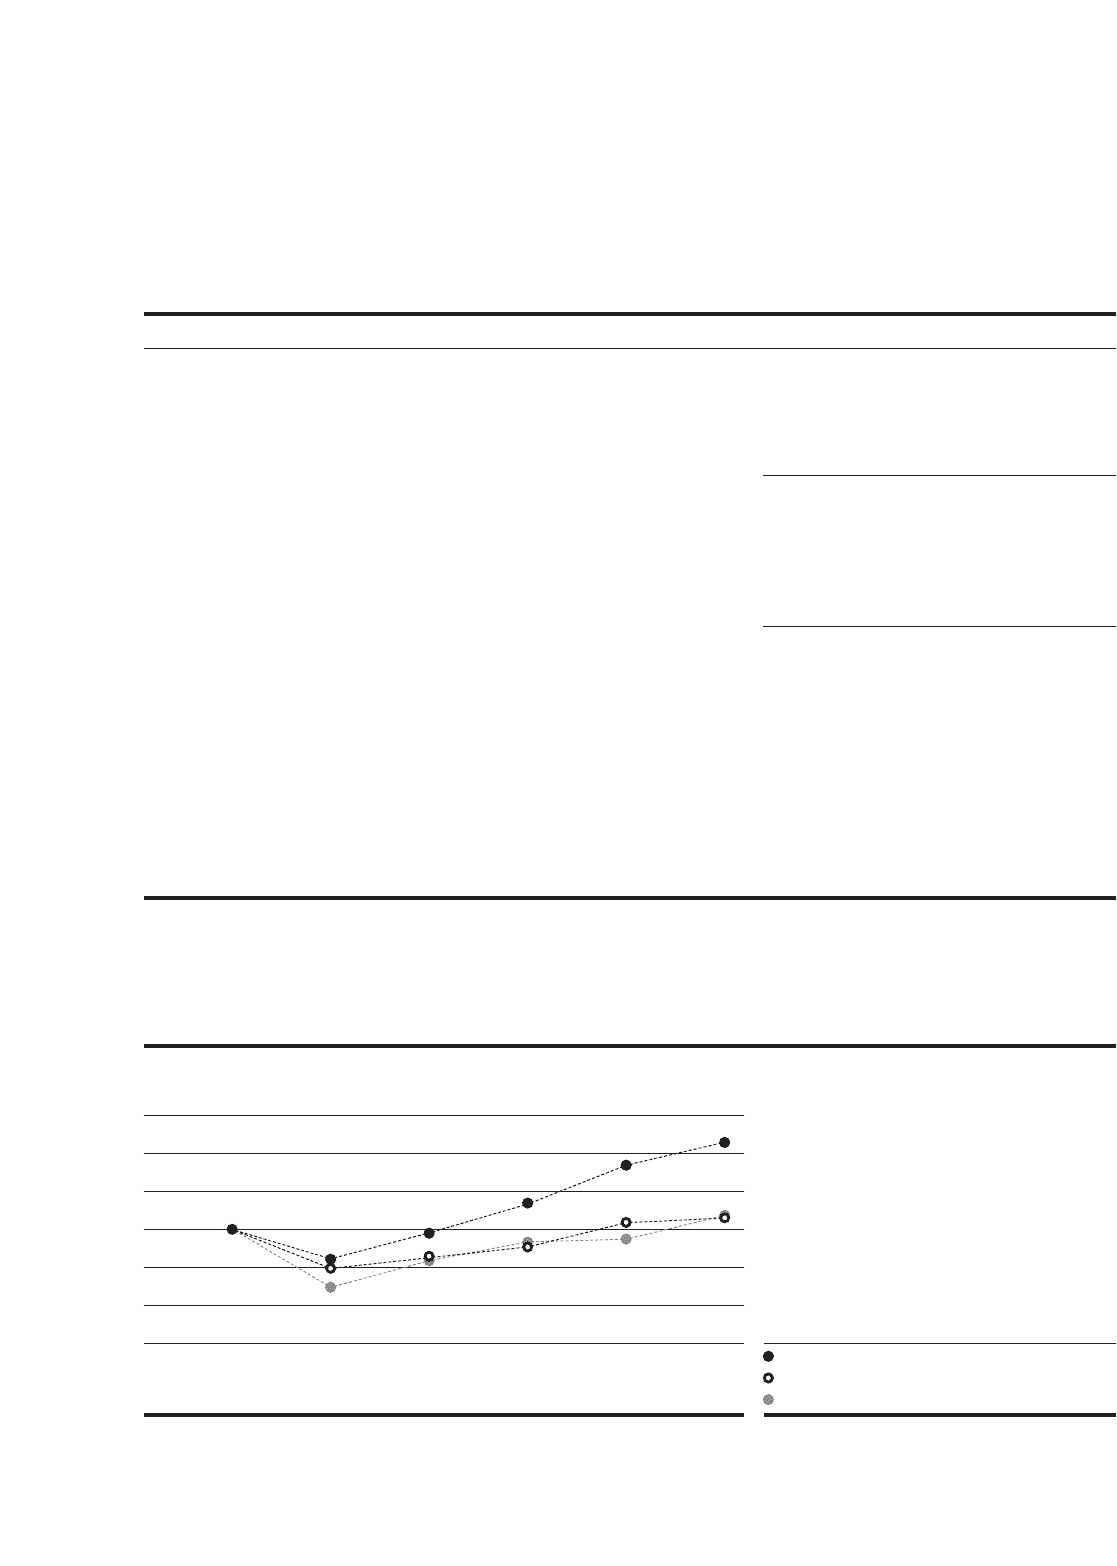
Stock Performance Comparison
PINNACLE WEST COMMON STOCK
EDISON ELECTRIC INSTITUTE INDEX
S&P 500 INDEX
(VALUE OF $100 INVESTED AS OF DECEMBER 31, 2007, WITH DIVIDENDS REINVESTED)
$100 $81 $98 $117 $143 $158
$100 $74 $82 $88 $105 $108
$ 100 $63 $80 $92 $94 $109
2007 2008 2009 2010 2011 2012