APS 2012 Annual Report Download - page 115
Download and view the complete annual report
Please find page 115 of the 2012 APS annual report below. You can navigate through the pages in the report by either clicking on the pages listed below, or by using the keyword search tool below to find specific information within the annual report.-
 1
1 -
2
-
3
-
4
-
5
-
6
-
7
-
8
-
9
-
10
-
11
-
12
-
13
-
14
-
15
-
16
-
17
-
18
-
19
-
20
-
21
-
22
-
23
-
24
-
25
-
26
-
27
-
28
-
29
-
30
-
31
-
32
-
33
-
34
-
35
-
36
-
37
-
38
-
39
-
40
-
41
-
42
-
43
-
44
-
45
-
46
-
47
-
48
-
49
-
50
-
51
-
52
-
53
-
54
-
55
-
56
-
57
-
58
-
59
-
60
-
61
-
62
-
63
-
64
-
65
-
66
-
67
-
68
-
69
-
70
-
71
-
72
-
73
-
74
-
75
-
76
-
77
-
78
-
79
-
80
-
81
-
82
-
83
-
84
-
85
-
86
-
87
-
88
-
89
-
90
-
91
-
92
-
93
-
94
-
95
-
96
-
97
-
98
-
99
-
100
-
101
-
102
-
103
-
104
-
 105
105 -
 106
106 -
 107
107 -
 108
108 -
 109
109 -
 110
110 -
 111
111 -
 112
112 -
 113
113 -
 114
114 -
 115
115 -
 116
116 -
 117
117 -
 118
118 -
 119
119 -
 120
120 -
 121
121 -
 122
122 -
 123
123 -
 124
124 -
 125
125 -
126
-
127
-
128
-
129
-
130
-
131
-
132
-
133
-
134
-
135
-
136
-
137
-
138
-
139
-
140
-
141
-
142
-
143
-
144
-
145
-
146
-
147
-
148
-
149
-
150
-
151
-
152
-
153
-
154
-
155
-
156
-
157
-
158
-
159
-
160
-
161
-
162
-
163
-
164
-
165
-
166
-
167
-
168
-
169
-
170
-
171
-
172
-
173
-
174
-
175
-
176
-
177
-
178
-
179
-
180
-
181
-
182
-
183
-
184
-
185
-
186
-
187
-
188
-
189
-
190
-
191
-
192
-
193
-
194
-
195
-
196
-
197
-
198
-
199
-
200
-
201
-
202
-
203
-
204
-
205
-
206
-
207
-
208
-
209
-
210
-
211
-
212
-
213
-
214
-
215
-
216
-
217
-
218
-
219
-
220
-
221
-
222
-
223
-
224
-
225
-
226
-
227
-
228
-
229
-
230
-
231
-
232
-
233
-
234
-
235
-
236
-
237
-
238
-
239
-
240
-
241
-
242
-
243
-
244
-
245
-
246
-
247
-
248
-
249
-
250
-
251
-
252
-
253
-
254
-
255
-
256
 |
 |
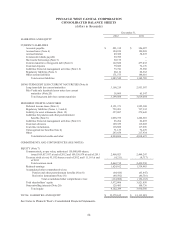
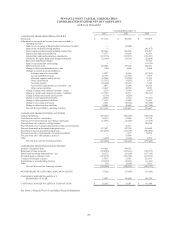
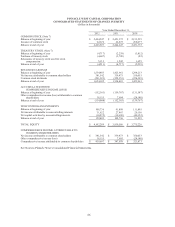
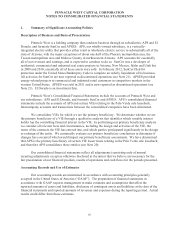
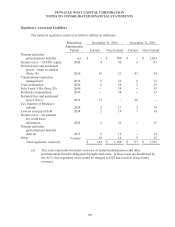
PINNACLE WEST CAPITAL CORPORATION
NOTES TO CONSOLIDATED FINANCIAL STATEMENTS
90
For the years 2010 through 2012, the depreciation rates ranged from a low of 0.45% to a high of
12.08%. The weighted-average rate was 2.71% for 2012, 2.98% for 2011, and 2.98% for 2010.
Allowance for Funds Used During Construction
AFUDC represents the approximate net composite interest cost of borrowed funds and an
allowed return on the equity funds used for construction of regulated utility plant. Both the debt and
equity components of AFUDC are non-cash amounts within the Consolidated Statement of Income.
Plant construction costs, including AFUDC, are recovered in authorized rates through depreciation
when completed projects are placed into commercial operation.
AFUDC was calculated by using a composite rate of 8.60% for 2012, 10.25% for 2011, and
9.2% for 2010. APS compounds AFUDC semi-annually and ceases to accrue AFUDC when
construction work is completed and the property is placed in service.
Materials and Supplies
APS values materials, supplies and fossil fuel inventory using a weighted-average cost method.
APS materials, supplies and fossil fuel inventories are carried at the lower of weighted-average cost or
market, unless evidence indicates that the weighted-average cost (even if in excess of market) will be
recovered.
Fair Value Measurements
We account for derivative instruments, investments held in our nuclear decommissioning trust,
certain cash equivalents and plan assets held in our retirement and other benefit plans at fair value on a
recurring basis. Due to the short-term nature of net accounts receivable, accounts payable, and short-
term borrowings, the carrying values of these instruments approximate fair value. Fair value
measurements may also be applied on a nonrecurring basis to other assets and liabilities in certain
circumstances such as impairments. We also disclose fair value information for our long-term debt,
which is carried at amortized cost (see Note 6).
Fair value is the price that would be received for an asset or paid to transfer a liability (exit
price) in the principal or most advantageous market which we can access for the asset or liability in an
orderly transaction between willing market participants on the measurement date. Inputs to fair value
may include observable and unobservable data. We maximize the use of observable inputs and
minimize the use of unobservable inputs when measuring fair value.
We determine fair market value using observable inputs such as actively-quoted prices for
identical instruments when available. When actively quoted prices are not available for the identical
instruments we use other observable inputs, such as prices for similar instruments, other corroborative
market information, or prices provided by other external sources. For options, long-term contracts and
other contracts for which observable price data are not available, we use models and other valuation
methods, which may incorporate unobservable inputs to determine fair market value.