APS 2012 Annual Report Download - page 130
Download and view the complete annual report
Please find page 130 of the 2012 APS annual report below. You can navigate through the pages in the report by either clicking on the pages listed below, or by using the keyword search tool below to find specific information within the annual report.-
 1
1 -
2
-
3
-
4
-
5
-
6
-
7
-
8
-
9
-
10
-
11
-
12
-
13
-
14
-
15
-
16
-
17
-
18
-
19
-
20
-
21
-
22
-
23
-
24
-
25
-
26
-
27
-
28
-
29
-
30
-
31
-
32
-
33
-
34
-
35
-
36
-
37
-
38
-
39
-
40
-
41
-
42
-
43
-
44
-
45
-
46
-
47
-
48
-
49
-
50
-
51
-
52
-
53
-
54
-
55
-
56
-
57
-
58
-
59
-
60
-
61
-
62
-
63
-
64
-
65
-
66
-
67
-
68
-
69
-
70
-
71
-
72
-
73
-
74
-
75
-
76
-
77
-
78
-
79
-
80
-
81
-
82
-
83
-
84
-
85
-
86
-
87
-
88
-
89
-
90
-
91
-
92
-
93
-
94
-
95
-
96
-
97
-
98
-
99
-
100
-
101
-
102
-
103
-
104
-
105
-
106
-
107
-
108
-
109
-
110
-
111
-
112
-
113
-
114
-
115
-
116
-
117
-
118
-
119
-
 120
120 -
 121
121 -
 122
122 -
 123
123 -
 124
124 -
 125
125 -
 126
126 -
 127
127 -
 128
128 -
 129
129 -
 130
130 -
 131
131 -
 132
132 -
 133
133 -
 134
134 -
 135
135 -
 136
136 -
 137
137 -
 138
138 -
 139
139 -
 140
140 -
141
-
142
-
143
-
144
-
145
-
146
-
147
-
148
-
149
-
150
-
151
-
152
-
153
-
154
-
155
-
156
-
157
-
158
-
159
-
160
-
161
-
162
-
163
-
164
-
165
-
166
-
167
-
168
-
169
-
170
-
171
-
172
-
173
-
174
-
175
-
176
-
177
-
178
-
179
-
180
-
181
-
182
-
183
-
184
-
185
-
186
-
187
-
188
-
189
-
190
-
191
-
192
-
193
-
194
-
195
-
196
-
197
-
198
-
199
-
200
-
201
-
202
-
203
-
204
-
205
-
206
-
207
-
208
-
209
-
210
-
211
-
212
-
213
-
214
-
215
-
216
-
217
-
218
-
219
-
220
-
221
-
222
-
223
-
224
-
225
-
226
-
227
-
228
-
229
-
230
-
231
-
232
-
233
-
234
-
235
-
236
-
237
-
238
-
239
-
240
-
241
-
242
-
243
-
244
-
245
-
246
-
247
-
248
-
249
-
250
-
251
-
252
-
253
-
254
-
255
-
256
 |
 |

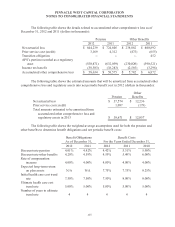
PINNACLE WEST CAPITAL CORPORATION
NOTES TO CONSOLIDATED FINANCIAL STATEMENTS
105
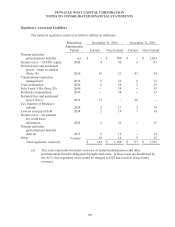
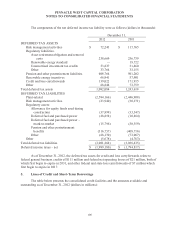
The components of the net deferred income tax liability were as follows (dollars in thousands):
December 31,
2012
2011
DEFERRED TAX ASSETS
Risk management activities
$ 72,243
$ 117,765
Regulatory liabilities:
Asset retirement obligation and removal
costs
238,669
236,739
Renewable energy standard
--
19,722
Unamortized investment tax credits
53,837
31,460
Other
33,764
33,155
Pension and other postretirement liabilities
408,764
501,202
Renewable energy incentives
66,941
57,901
Credit and loss carryforwards
139,022
171,915
Other
68,844
73,759
Total deferred tax assets
1,082,084
1,243,618
DEFERRED TAX LIABILITIES
Plant-related
(2,584,166)
(2,446,908)
Risk management activities
(23,940)
(30,171)
Regulatory assets:
Allowance for equity funds used during
construction
(37,899)
(33,347)
Deferred fuel and purchased power
(28,858)
(10,884)
Deferred fuel and purchased power –
mark-to-market
(15,796)
(30,559)
Pension and other postretirement
benefits
(316,757)
(408,716)
Other
(68,170)
(73,087)
Other
(5,678)
(4,763)
Total deferred tax liabilities
(3,081,264)
(3,038,435)
Deferred income taxes – net
$ (1,999,180)
$ (1,794,817)
As of December 31, 2012, the deferred tax assets for credit and loss carryforwards relate to
federal general business credits of $111 million and federal net operating losses of $21 million, both of
which first begin to expire in 2031, and other federal and state loss carryforwards of $7 million which
first begin to expire in 2017.
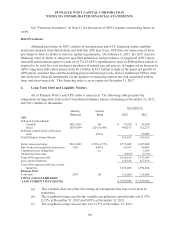
5. Lines of Credit and Short-Term Borrowings
The table below presents the consolidated credit facilities and the amounts available and
outstanding as of December 31, 2012 (dollars in millions):