APS 2012 Annual Report Download - page 186
Download and view the complete annual report
Please find page 186 of the 2012 APS annual report below. You can navigate through the pages in the report by either clicking on the pages listed below, or by using the keyword search tool below to find specific information within the annual report.-
 1
1 -
2
-
3
-
4
-
5
-
6
-
7
-
8
-
9
-
10
-
11
-
12
-
13
-
14
-
15
-
16
-
17
-
18
-
19
-
20
-
21
-
22
-
23
-
24
-
25
-
26
-
27
-
28
-
29
-
30
-
31
-
32
-
33
-
34
-
35
-
36
-
37
-
38
-
39
-
40
-
41
-
42
-
43
-
44
-
45
-
46
-
47
-
48
-
49
-
50
-
51
-
52
-
53
-
54
-
55
-
56
-
57
-
58
-
59
-
60
-
61
-
62
-
63
-
64
-
65
-
66
-
67
-
68
-
69
-
70
-
71
-
72
-
73
-
74
-
75
-
76
-
77
-
78
-
79
-
80
-
81
-
82
-
83
-
84
-
85
-
86
-
87
-
88
-
89
-
90
-
91
-
92
-
93
-
94
-
95
-
96
-
97
-
98
-
99
-
100
-
101
-
102
-
103
-
104
-
105
-
106
-
107
-
108
-
109
-
110
-
111
-
112
-
113
-
114
-
115
-
116
-
117
-
118
-
119
-
120
-
121
-
122
-
123
-
124
-
125
-
126
-
127
-
128
-
129
-
130
-
131
-
132
-
133
-
134
-
135
-
136
-
137
-
138
-
139
-
140
-
141
-
142
-
143
-
144
-
145
-
146
-
147
-
148
-
149
-
150
-
151
-
152
-
153
-
154
-
155
-
156
-
157
-
158
-
159
-
160
-
161
-
162
-
163
-
164
-
165
-
166
-
167
-
168
-
169
-
170
-
171
-
172
-
173
-
174
-
175
-
 176
176 -
 177
177 -
 178
178 -
 179
179 -
 180
180 -
 181
181 -
 182
182 -
 183
183 -
 184
184 -
 185
185 -
 186
186 -
 187
187 -
 188
188 -
 189
189 -
 190
190 -
 191
191 -
 192
192 -
 193
193 -
 194
194 -
 195
195 -
 196
196 -
197
-
198
-
199
-
200
-
201
-
202
-
203
-
204
-
205
-
206
-
207
-
208
-
209
-
210
-
211
-
212
-
213
-
214
-
215
-
216
-
217
-
218
-
219
-
220
-
221
-
222
-
223
-
224
-
225
-
226
-
227
-
228
-
229
-
230
-
231
-
232
-
233
-
234
-
235
-
236
-
237
-
238
-
239
-
240
-
241
-
242
-
243
-
244
-
245
-
246
-
247
-
248
-
249
-
250
-
251
-
252
-
253
-
254
-
255
-
256
 |
 |

161
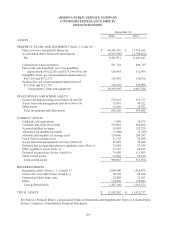
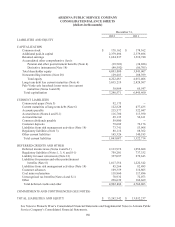
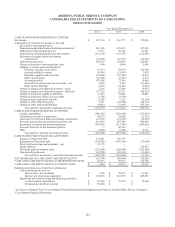
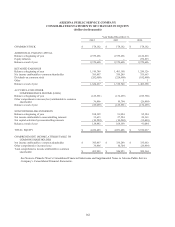
ARIZONA PUBLIC SERVICE COMPANY
CONSOLIDATED STATEMENTS OF CASH FLOWS
(dollars in thousands)
Year Ended December 31,
2012
2011
2010
CASH FLOWS FROM OPERATING ACTIVITIES
Net income
$ 427,110
$ 363,773
$ 355,826
Adjustments to reconcile net income to net cash
provided by operating activities:
Depreciation and amortization including nuclear fuel
481,168
493,653
471,226
Deferred fuel and purchased power
71,573
69,166
93,631
Deferred fuel and purchased power amortization
(116,716)
(155,157)
(122,481)
Allowance for equity funds used during
construction
(22,436)
(23,707)
(22,066)
Deferred income taxes
243,738
168,805
224,095
Change in derivative instruments fair value
(749)
4,064
2,688
Changes in current assets and liabilities:
Customer and other receivables
12,914
34,913
(49,956)
Accrued unbilled revenues
30,394
(21,947)
7,679
Materials, supplies and fossil fuel
(23,043)
(23,398)
12,276
Other current assets
(27,745)
(5,473)
4,718
Accounts payable
(97,395)
73,369
18,066
Accrued taxes and income tax receivable – net
5,050
5,103
(51,620)
Other current liabilities
6,070
18,762
(2,853)
Change in margin and collateral accounts – assets
2,216
33,349
(9,937)
Change in margin and collateral accounts – liabilities
137,785
29,731
(88,315)
Change in long-term regulatory liabilities
13,539
37,009
56,801
Change in long-term income tax receivable
(1,756)
(3,530)
--
Change in unrecognized tax benefits
(2,583)
9,125
(73,189)
Change in other long-term assets
1,391
(41,788)
(46,118)
Change in other long-term liabilities
34,854
61,990
(85,136)
Net cash flow provided by operating activities
1,175,379
1,127,812
695,335
CASH FLOWS FROM INVESTING ACTIVITIES
Capital expenditures
(889,551)
(878,546)
(747,967)
Contributions in aid of construction
49,876
38,096
32,754
Allowance for borrowed funds used during construction
(14,971)
(18,358)
(16,479)
Proceeds from nuclear decommissioning trust sales
417,603
497,780
560,469
Investment in nuclear decommissioning trust
(434,852)
(513,799)
(584,885)
Proceeds from sale of life insurance policies
--
44,183
--
Other
(1,099)
(3,306)
8,576
Net cash flow used for investing activities
(872,994)
(833,950)
(747,532)
CASH FLOWS FROM FINANCING ACTIVITIES
Issuance of long-term debt
351,081
295,353
--
Repayment of long-term debt
(529,286)
(430,169)
(27,694)
Short-term borrowings and payments – net
92,175
--
--
Equity infusion
--
--
252,833
Dividends paid on common stock
(222,200)
(228,900)
(182,400)
Noncontrolling interests
(10,529)
(10,210)
(11,403)
Net cash flow provided by (used for) financing activities
(318,759)
(373,926)
31,336
NET DECREASE IN CASH AND CASH EQUIVALENTS
(16,374)
(80,064)
(20,861)
CASH AND CASH EQUIVALENTS AT BEGINNING OF YEAR
19,873
99,937
120,798
CASH AND CASH EQUIVALENTS AT END OF YEAR
$ 3,499
$ 19,873
$ 99,937
Supplemental disclosure of cash flow information:
Cash paid during the year for:
Income taxes, net of refunds
$ 1,196
$ 25,975
$ 81,339
Interest, net of amounts capitalized
$ 196,038
$ 210,995
$ 208,251
Significant non-cash investing and financing activities:
Accrued capital expenditures
$ 26,208
$ 27,245
$ 19,226
Dividends declared but not paid
$ 59,800
$ --
$ --
See Notes to Pinnacle West’s Consolidated Financial Statements and Supplemental Notes to Arizona Public Service Company’s
Consolidated Financial Statements.