APS 2012 Annual Report Download - page 20
Download and view the complete annual report
Please find page 20 of the 2012 APS annual report below. You can navigate through the pages in the report by either clicking on the pages listed below, or by using the keyword search tool below to find specific information within the annual report.-
 1
1 -
2
-
3
-
4
-
5
-
6
-
7
-
8
-
9
-
 10
10 -
 11
11 -
 12
12 -
 13
13 -
 14
14 -
 15
15 -
 16
16 -
 17
17 -
 18
18 -
 19
19 -
 20
20 -
 21
21 -
 22
22 -
 23
23 -
 24
24 -
 25
25 -
 26
26 -
 27
27 -
 28
28 -
 29
29 -
 30
30 -
31
-
32
-
33
-
34
-
35
-
36
-
37
-
38
-
39
-
40
-
41
-
42
-
43
-
44
-
45
-
46
-
47
-
48
-
49
-
50
-
51
-
52
-
53
-
54
-
55
-
56
-
57
-
58
-
59
-
60
-
61
-
62
-
63
-
64
-
65
-
66
-
67
-
68
-
69
-
70
-
71
-
72
-
73
-
74
-
75
-
76
-
77
-
78
-
79
-
80
-
81
-
82
-
83
-
84
-
85
-
86
-
87
-
88
-
89
-
90
-
91
-
92
-
93
-
94
-
95
-
96
-
97
-
98
-
99
-
100
-
101
-
102
-
103
-
104
-
105
-
106
-
107
-
108
-
109
-
110
-
111
-
112
-
113
-
114
-
115
-
116
-
117
-
118
-
119
-
120
-
121
-
122
-
123
-
124
-
125
-
126
-
127
-
128
-
129
-
130
-
131
-
132
-
133
-
134
-
135
-
136
-
137
-
138
-
139
-
140
-
141
-
142
-
143
-
144
-
145
-
146
-
147
-
148
-
149
-
150
-
151
-
152
-
153
-
154
-
155
-
156
-
157
-
158
-
159
-
160
-
161
-
162
-
163
-
164
-
165
-
166
-
167
-
168
-
169
-
170
-
171
-
172
-
173
-
174
-
175
-
176
-
177
-
178
-
179
-
180
-
181
-
182
-
183
-
184
-
185
-
186
-
187
-
188
-
189
-
190
-
191
-
192
-
193
-
194
-
195
-
196
-
197
-
198
-
199
-
200
-
201
-
202
-
203
-
204
-
205
-
206
-
207
-
208
-
209
-
210
-
211
-
212
-
213
-
214
-
215
-
216
-
217
-
218
-
219
-
220
-
221
-
222
-
223
-
224
-
225
-
226
-
227
-
228
-
229
-
230
-
231
-
232
-
233
-
234
-
235
-
236
-
237
-
238
-
239
-
240
-
241
-
242
-
243
-
244
-
245
-
246
-
247
-
248
-
249
-
250
-
251
-
252
-
253
-
254
-
255
-
256
 |
 |

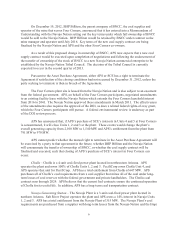
momentum 2012 ANNUAL REPORT
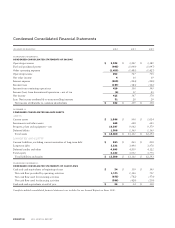
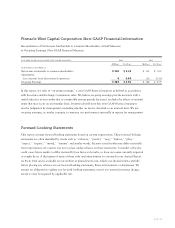
Condensed Consolidated Financial Statements
(DOLLARS IN MILLIONS) 2012 2011 2010
YEAR ENDED DECEMBER 31,
condensed consolidated statements of income
Operating revenues $ 3,302 $ 3,241 $ 3,189
Fuel and purchased power (995 ) (1,009 ) (1,047 )
Other operating expenses (1,455 ) (1,485 ) (1,427 )
Operating income 852 747 715
Net other income 4 16 19
Interest expense (200 ) (224 ) (228 )
Income taxes (237 ) (183 ) (161 )
Income from continuing operations 419 356 345
Income (loss) from discontinued operations – net of tax (6 ) 11 25
Net income 413 367 370
Less: Net income attributable to noncontrolling interests 31 28 20
Net income attributable to common shareholders $ 382 $ 339 $ 350
DECEMBER 31,
condensed consolidated balance sHeets
ASSETS
Current assets $ 1,006 $ 956 $ 1,024
Investments and other assets 669 628 625
Property, plant and equipment – net 10,397 9,962 9,579
Deferred debits 1,308 1,565 1,165
Total assets $ 13,380 $ 13,111 $ 12,393
LIABILITIES AND EQUITY
Current liabilities, excluding current maturities of long-term debt $ 961 $ 865 $ 818
Long-term debt 3,322 3,496 3,678
Deferred credits and other 4,995 4,819 4,122
Total equity 4,102 3,931 3,775
Total liabilities and equity $ 13,380 $ 13,111 $ 12,393
YEAR ENDED DECEMBER 31,
condensed consolidated statements of casH floWs
Cash and cash equivalents at beginning of year $ 34 $ 110 $ 145
Net cash flow provided by operating activities 1,171 1,126 751
Net cash flow used for investing activities (873 ) (782 ) (576 )
Net cash flow used for financing activities (306 ) (420 ) (210 )
Cash and cash equivalents at end of year $ 26 $ 34 $ 110
Complete audited consolidated financial statements are included in our Annual Report on Form 10-K.