APS 2012 Annual Report Download - page 78
Download and view the complete annual report
Please find page 78 of the 2012 APS annual report below. You can navigate through the pages in the report by either clicking on the pages listed below, or by using the keyword search tool below to find specific information within the annual report.-
 1
1 -
2
-
3
-
4
-
5
-
6
-
7
-
8
-
9
-
10
-
11
-
12
-
13
-
14
-
15
-
16
-
17
-
18
-
19
-
20
-
21
-
22
-
23
-
24
-
25
-
26
-
27
-
28
-
29
-
30
-
31
-
32
-
33
-
34
-
35
-
36
-
37
-
38
-
39
-
40
-
41
-
42
-
43
-
44
-
45
-
46
-
47
-
48
-
49
-
50
-
51
-
52
-
53
-
54
-
55
-
56
-
57
-
58
-
59
-
60
-
61
-
62
-
63
-
64
-
65
-
66
-
67
-
 68
68 -
 69
69 -
 70
70 -
 71
71 -
 72
72 -
 73
73 -
 74
74 -
 75
75 -
 76
76 -
 77
77 -
 78
78 -
 79
79 -
 80
80 -
 81
81 -
 82
82 -
 83
83 -
 84
84 -
 85
85 -
 86
86 -
 87
87 -
 88
88 -
89
-
90
-
91
-
92
-
93
-
94
-
95
-
96
-
97
-
98
-
99
-
100
-
101
-
102
-
103
-
104
-
105
-
106
-
107
-
108
-
109
-
110
-
111
-
112
-
113
-
114
-
115
-
116
-
117
-
118
-
119
-
120
-
121
-
122
-
123
-
124
-
125
-
126
-
127
-
128
-
129
-
130
-
131
-
132
-
133
-
134
-
135
-
136
-
137
-
138
-
139
-
140
-
141
-
142
-
143
-
144
-
145
-
146
-
147
-
148
-
149
-
150
-
151
-
152
-
153
-
154
-
155
-
156
-
157
-
158
-
159
-
160
-
161
-
162
-
163
-
164
-
165
-
166
-
167
-
168
-
169
-
170
-
171
-
172
-
173
-
174
-
175
-
176
-
177
-
178
-
179
-
180
-
181
-
182
-
183
-
184
-
185
-
186
-
187
-
188
-
189
-
190
-
191
-
192
-
193
-
194
-
195
-
196
-
197
-
198
-
199
-
200
-
201
-
202
-
203
-
204
-
205
-
206
-
207
-
208
-
209
-
210
-
211
-
212
-
213
-
214
-
215
-
216
-
217
-
218
-
219
-
220
-
221
-
222
-
223
-
224
-
225
-
226
-
227
-
228
-
229
-
230
-
231
-
232
-
233
-
234
-
235
-
236
-
237
-
238
-
239
-
240
-
241
-
242
-
243
-
244
-
245
-
246
-
247
-
248
-
249
-
250
-
251
-
252
-
253
-
254
-
255
-
256
 |
 |
54
communities, land parcels, commercial assets and golf courses in order to eliminate its outstanding debt
and, as of December 31, 2012, SunCor had no assets. In February 2012, SunCor filed for protection
under the United States Bankruptcy Code to complete an orderly liquidation of its business. All
activities of SunCor are now reported as discontinued operations (see Note 21). SunCor’s loss in 2012
is primarily related to a contribution Pinnacle West expects to make to SunCor’s estate as part of a
negotiated resolution to the bankruptcy. We do not expect SunCor’s bankruptcy to have a material
impact on Pinnacle West’s financial position, results of operations or cash flows.
Key Financial Drivers
In addition to the continuing impact of the matters described above, many factors influence our
financial results and our future financial outlook, including those listed below. We closely monitor
these factors to plan for the Company’s current needs, and to adjust our expectations, financial budgets
and forecasts appropriately.
Electric Operating Revenues. For the years 2010 through 2012, retail electric revenues
comprised approximately 93% of our total electric operating revenues. Our electric operating revenues
are affected by customer growth or decline, variations in weather from period to period, customer mix,
average usage per customer and the impacts of energy efficiency programs, distributed energy additions,
electricity rates and tariffs, the recovery of PSA deferrals and the operation of other recovery
mechanisms. Off-system sales of excess generation output, purchased power and natural gas are
included in operating revenues and related fuel and purchased power because they are credited to APS’s
retail customers through the PSA. These revenue transactions are affected by the availability of excess
generation or other energy resources and wholesale market conditions, including competition, demand
and prices.
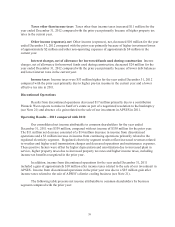
Customer and Sales Growth. Retail customer growth in APS’s service territory in 2012 was
1.1% compared with the comparable prior year. For the three years 2010 through 2012, APS’s
customer growth averaged 0.7% per year. We currently expect annual customer growth to average
about 2% for 2013 through 2015 based on our assessment of modestly improving economic conditions,
both nationally and in Arizona. Retail electricity sales in kilowatt-hours, adjusted to exclude the effects
of weather variations, increased 0.1% in 2012 compared with the prior year, reflecting the effects of
customer conservation and energy efficiency and distributed renewable generation initiatives, offset by
mildly improving economic conditions. For the three years 2010 through 2012, APS experienced
annual declines in retail electricity sales averaging 0.1%, adjusted to exclude the effects of weather
variations. We currently estimate that annual retail electricity sales in kilowatt-hours will remain about
flat on average during 2013 through 2015, including the effects of customer conservation and energy
efficiency and distributed renewable generation initiatives, but excluding the effects of weather
variations. A failure of the Arizona economy to continue to improve could further impact these
estimates.
Actual sales growth, excluding weather-related variations, may differ from our projections as a
result of numerous factors, such as economic conditions, customer growth, usage patterns, impacts of
energy efficiency programs and growth in distributed generation, and responses to retail price changes.
Our experience indicates that a reasonable range of variation in our kilowatt-hour sales projection
attributable to such economic factors under normal business conditions can result in increases or
decreases in annual net income of up to $10 million.